Week 4
Exploratory Data Analyses
- Instructors
- Maclean Gaulin
What is exploratory Data analysis?
- Initial analysis to understand data and its structure
- Data types, distributions, statistics
- Can illuminate data issues
- Missing data, outliers, errors
- Identify broad patterns or regularities
- Relationships, clustering, temporal regularity
- Build intuition and inform hypothesis development
Why use EDA?
- “You can see a lot, just by looking” ~ Yogi Berra
- EDA establishes understanding of the data before assumptions are made or complex modeling techniques are applied
- More EDA now, fewer mistakes later
- Finds “unknown unknowns”
- Be curious and judgmental
- Skepticism is important, look for errors, bias, misinformation, etc.
EDA Caveats
- Confirmation Bias – the tendency to subconsciously identify, prefer, or interpret information in a way that confirms pre-existing beliefs or hypotheses
- Look for patterns that contradict initial ideas or expectations
- Require higher burden of proof for conclusions that align with priors
- Correlation vs. Causation – relationships discovered with EDA do not necessarily entail causal (functional) relationships
- Observing that two variables move together during EDA does not prove that one causes the other
- Establishing causal relationships requires experiments or causal inference
- Note: correlation is not causation, but they are highly correlated
Caution
- “There are 3 kinds of lies: lies, damned lies, and statistics.” ~ Mark Twain
- Visualizations can be misleading (intentionally or not)
- Important to consider whether the interpretation of your visualization will be what is intended
Common Visualization mistakes
- Visual distortion
- Cherry-picking Data
- Outlier treatment
- Misleading Aggregations
- Comparing Dissimilar Data
Visual Distortion
- Truncation: Truncating axes can make variation appear greater or less
- Scaling: Scaling axes by non-constant amounts distorts visual comparison
- Log-scale axes are an example of well-understood non-constant scaling
- Twin axes: A second axis can be misleading if using same units as first
Truncated Axes
Scaled Axes
Cherry-Picking Data
- Including only those observations that support a specific conclusion or omitting contradictory evidence
- Removing outliers without justification can present a cleaner, but potentially misleading, picture
- Selecting sub-group may imply the results generalize to the full group
Misleading Aggregation
- Using the mean for highly skewed data can be misleading, where the median might be better
- Aggregating data can mask recent changes in trends
mean vs median
- Median is “middle” of data
- Data: https://www.cbo.gov/publication/60706#_idTextAnchor039
mean vs median
- Median is “middle” of data
- Mean (expected value) is weighted by values
- Data: https://www.cbo.gov/publication/60706#_idTextAnchor039
mean vs median
- Median is “middle” of data
- Mean (expected value) is weighted by values
- Be careful to assess what you believe your audience will interpret each to mean
- Data: https://www.cbo.gov/publication/60706#_idTextAnchor039
Misleading Axis redux
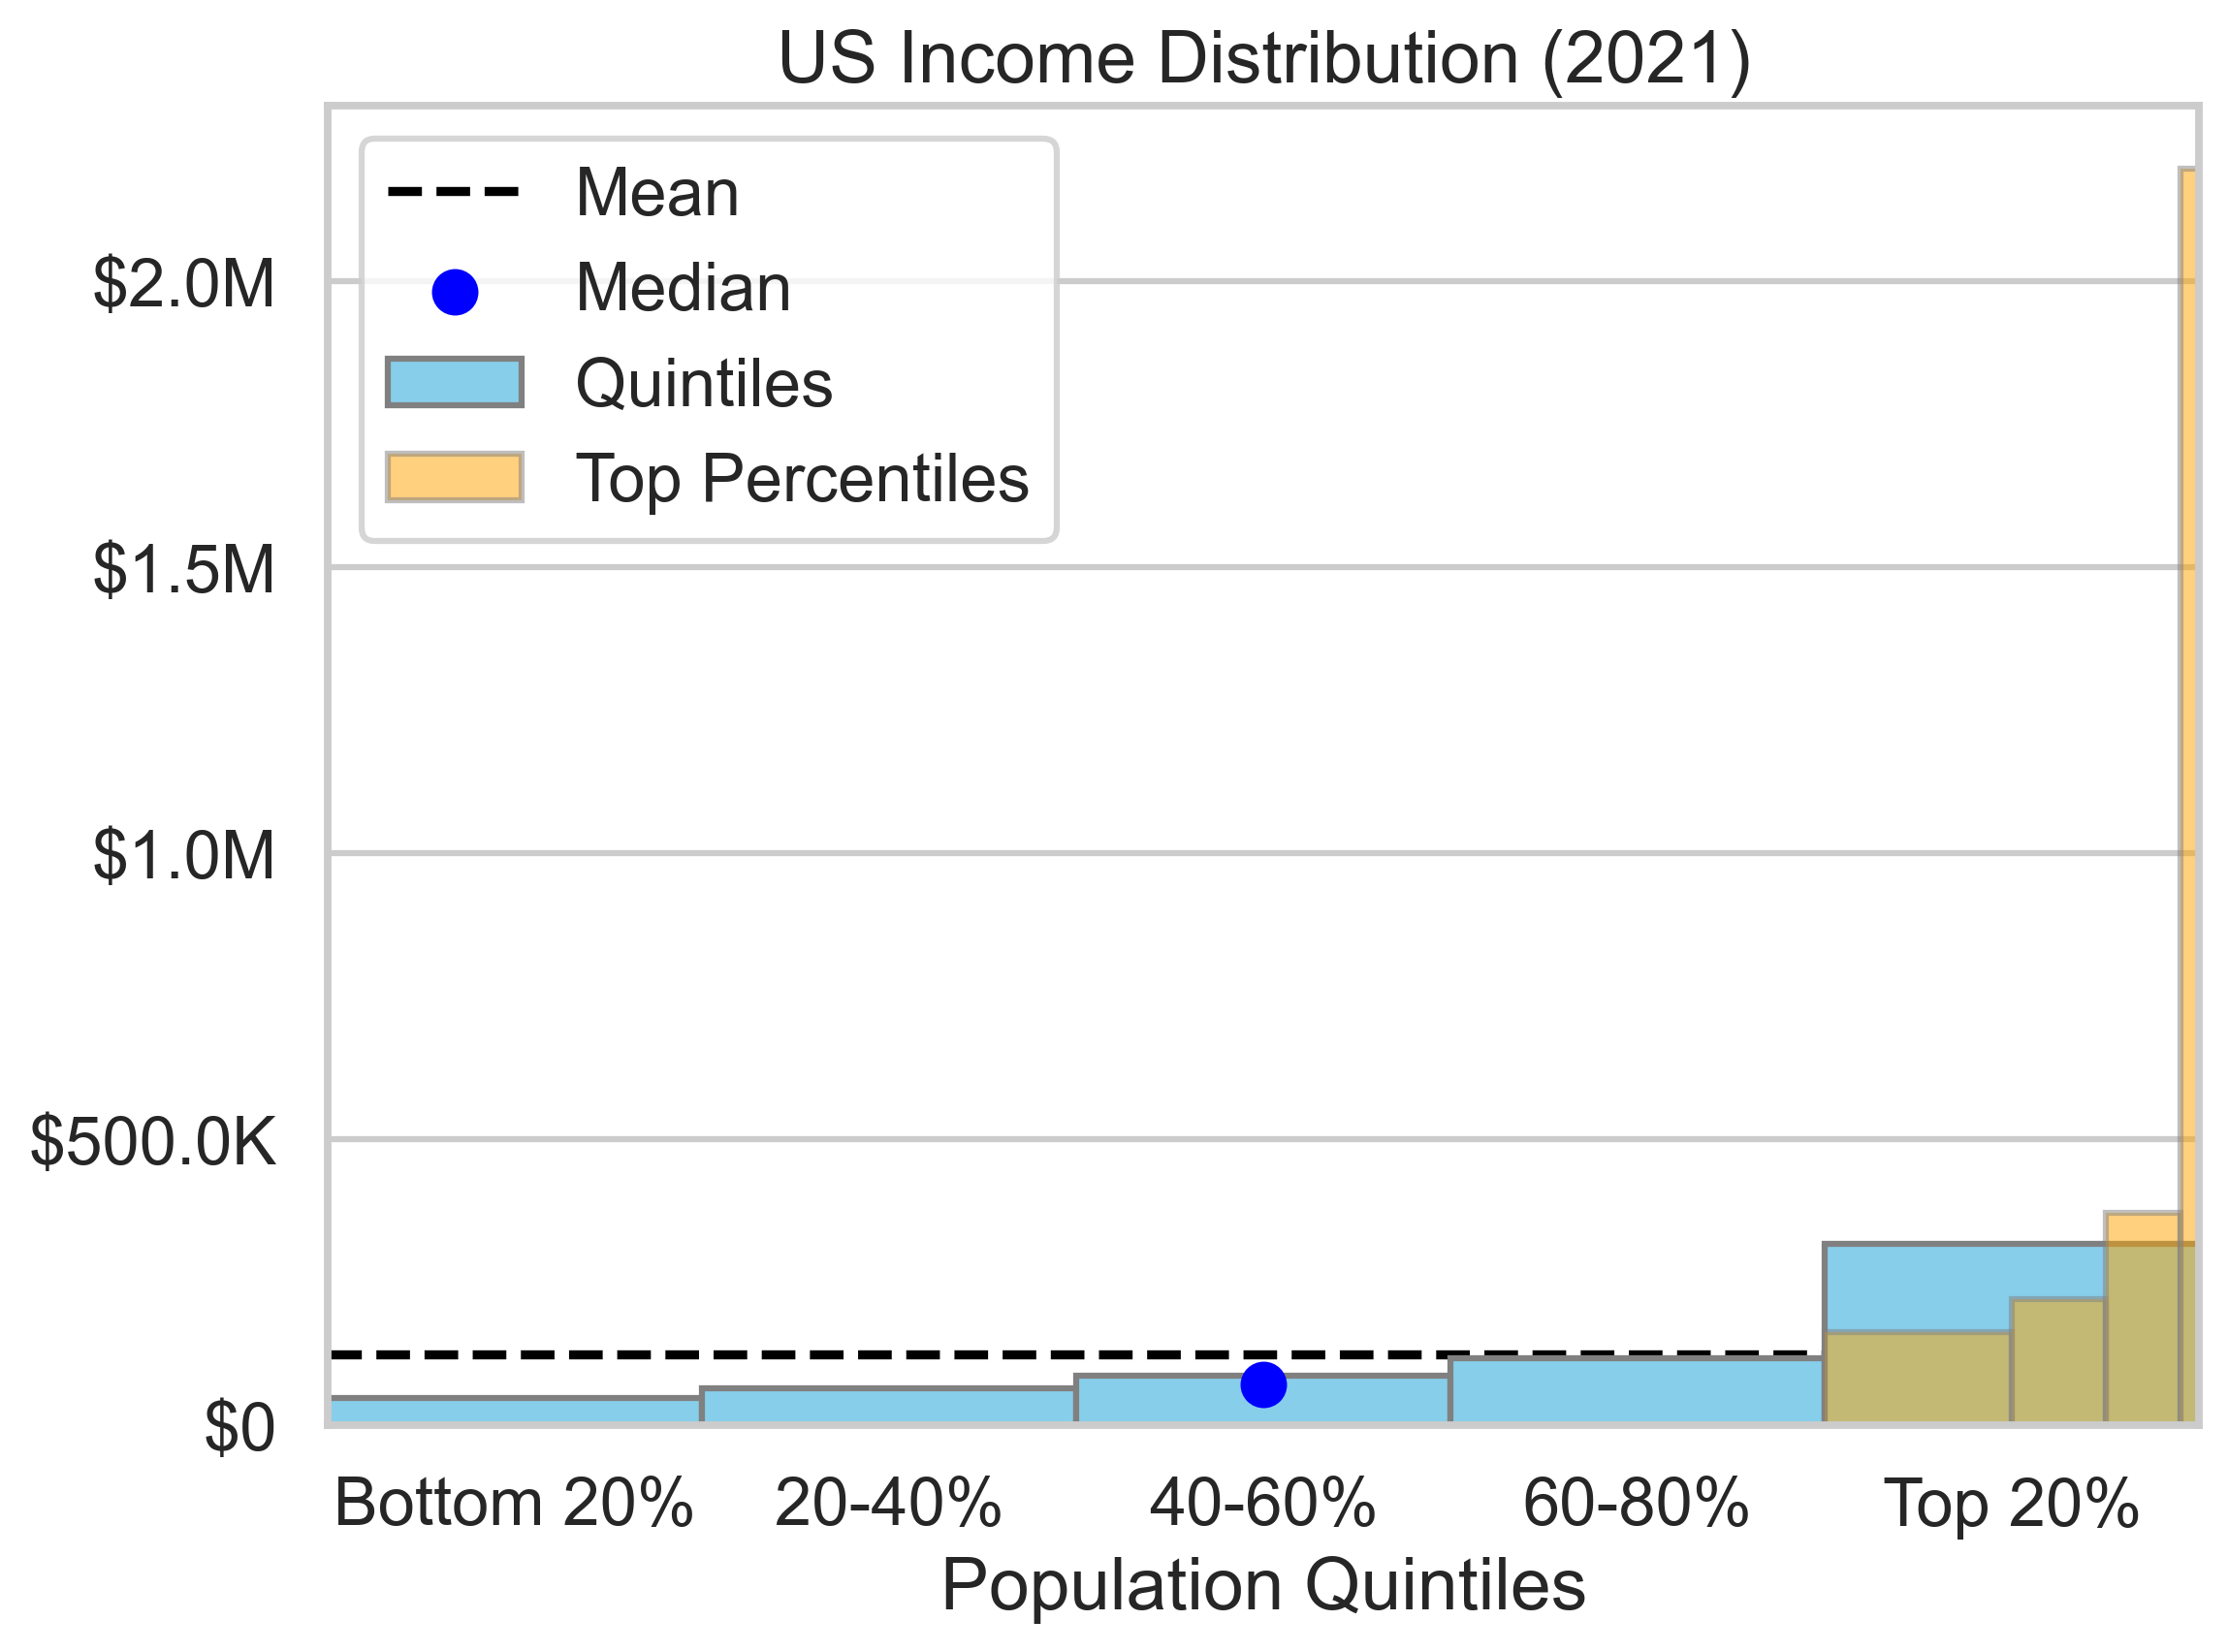
- Data: https://www.cbo.gov/publication/60706#_idTextAnchor039
Comparing Dissimilar Data
- Comparing metrics that aren’t truly comparable (e.g., plotting levels and percentages on the same graph without clear labels)
- Plotting spurious correlations together to imply a relationship
- e.g., tylervigen.com/spurious-correlations
Spurious Correlations
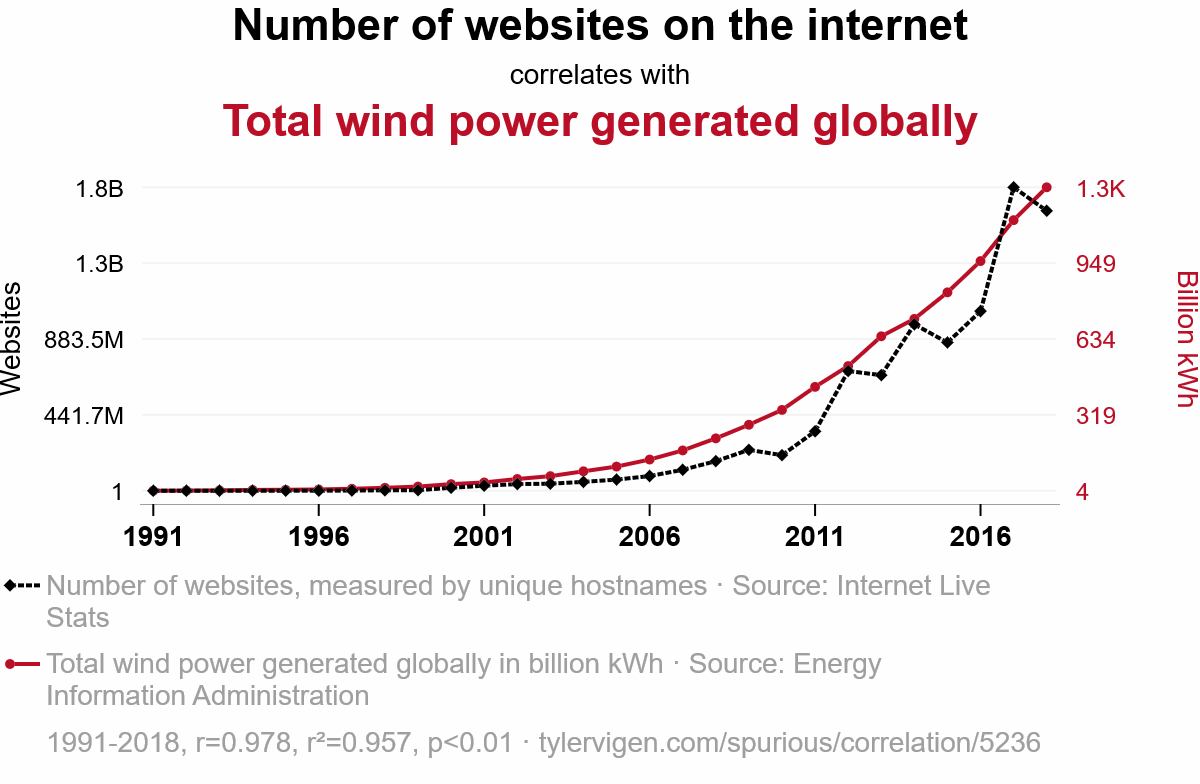
- Credit Tyler Vigen
Exploring Data Quality
- Missing data: drop observations, fill with default, interpolate based on some model
- Input errors: unit errors, transcription errors (OCR, human input)
- Processing errors: conversion logic errors (e.g. date formatting), calculation errors (e.g., divide by 0)
- Duplicates: mistakes or informative
- Outliers: caused by errors, uninformative observations, informative and necessary to understand
Multidimensional data
- Multiple measurements for single observation
- Journal entry – date, account info, names, amount, etc.
- Consumer – demographics, location, interactions
- Financials
- Multidimensional due to computer representation
- Location stored as latitude and longitude (& height?)
- Text? Images?
Seeing beyond 2D
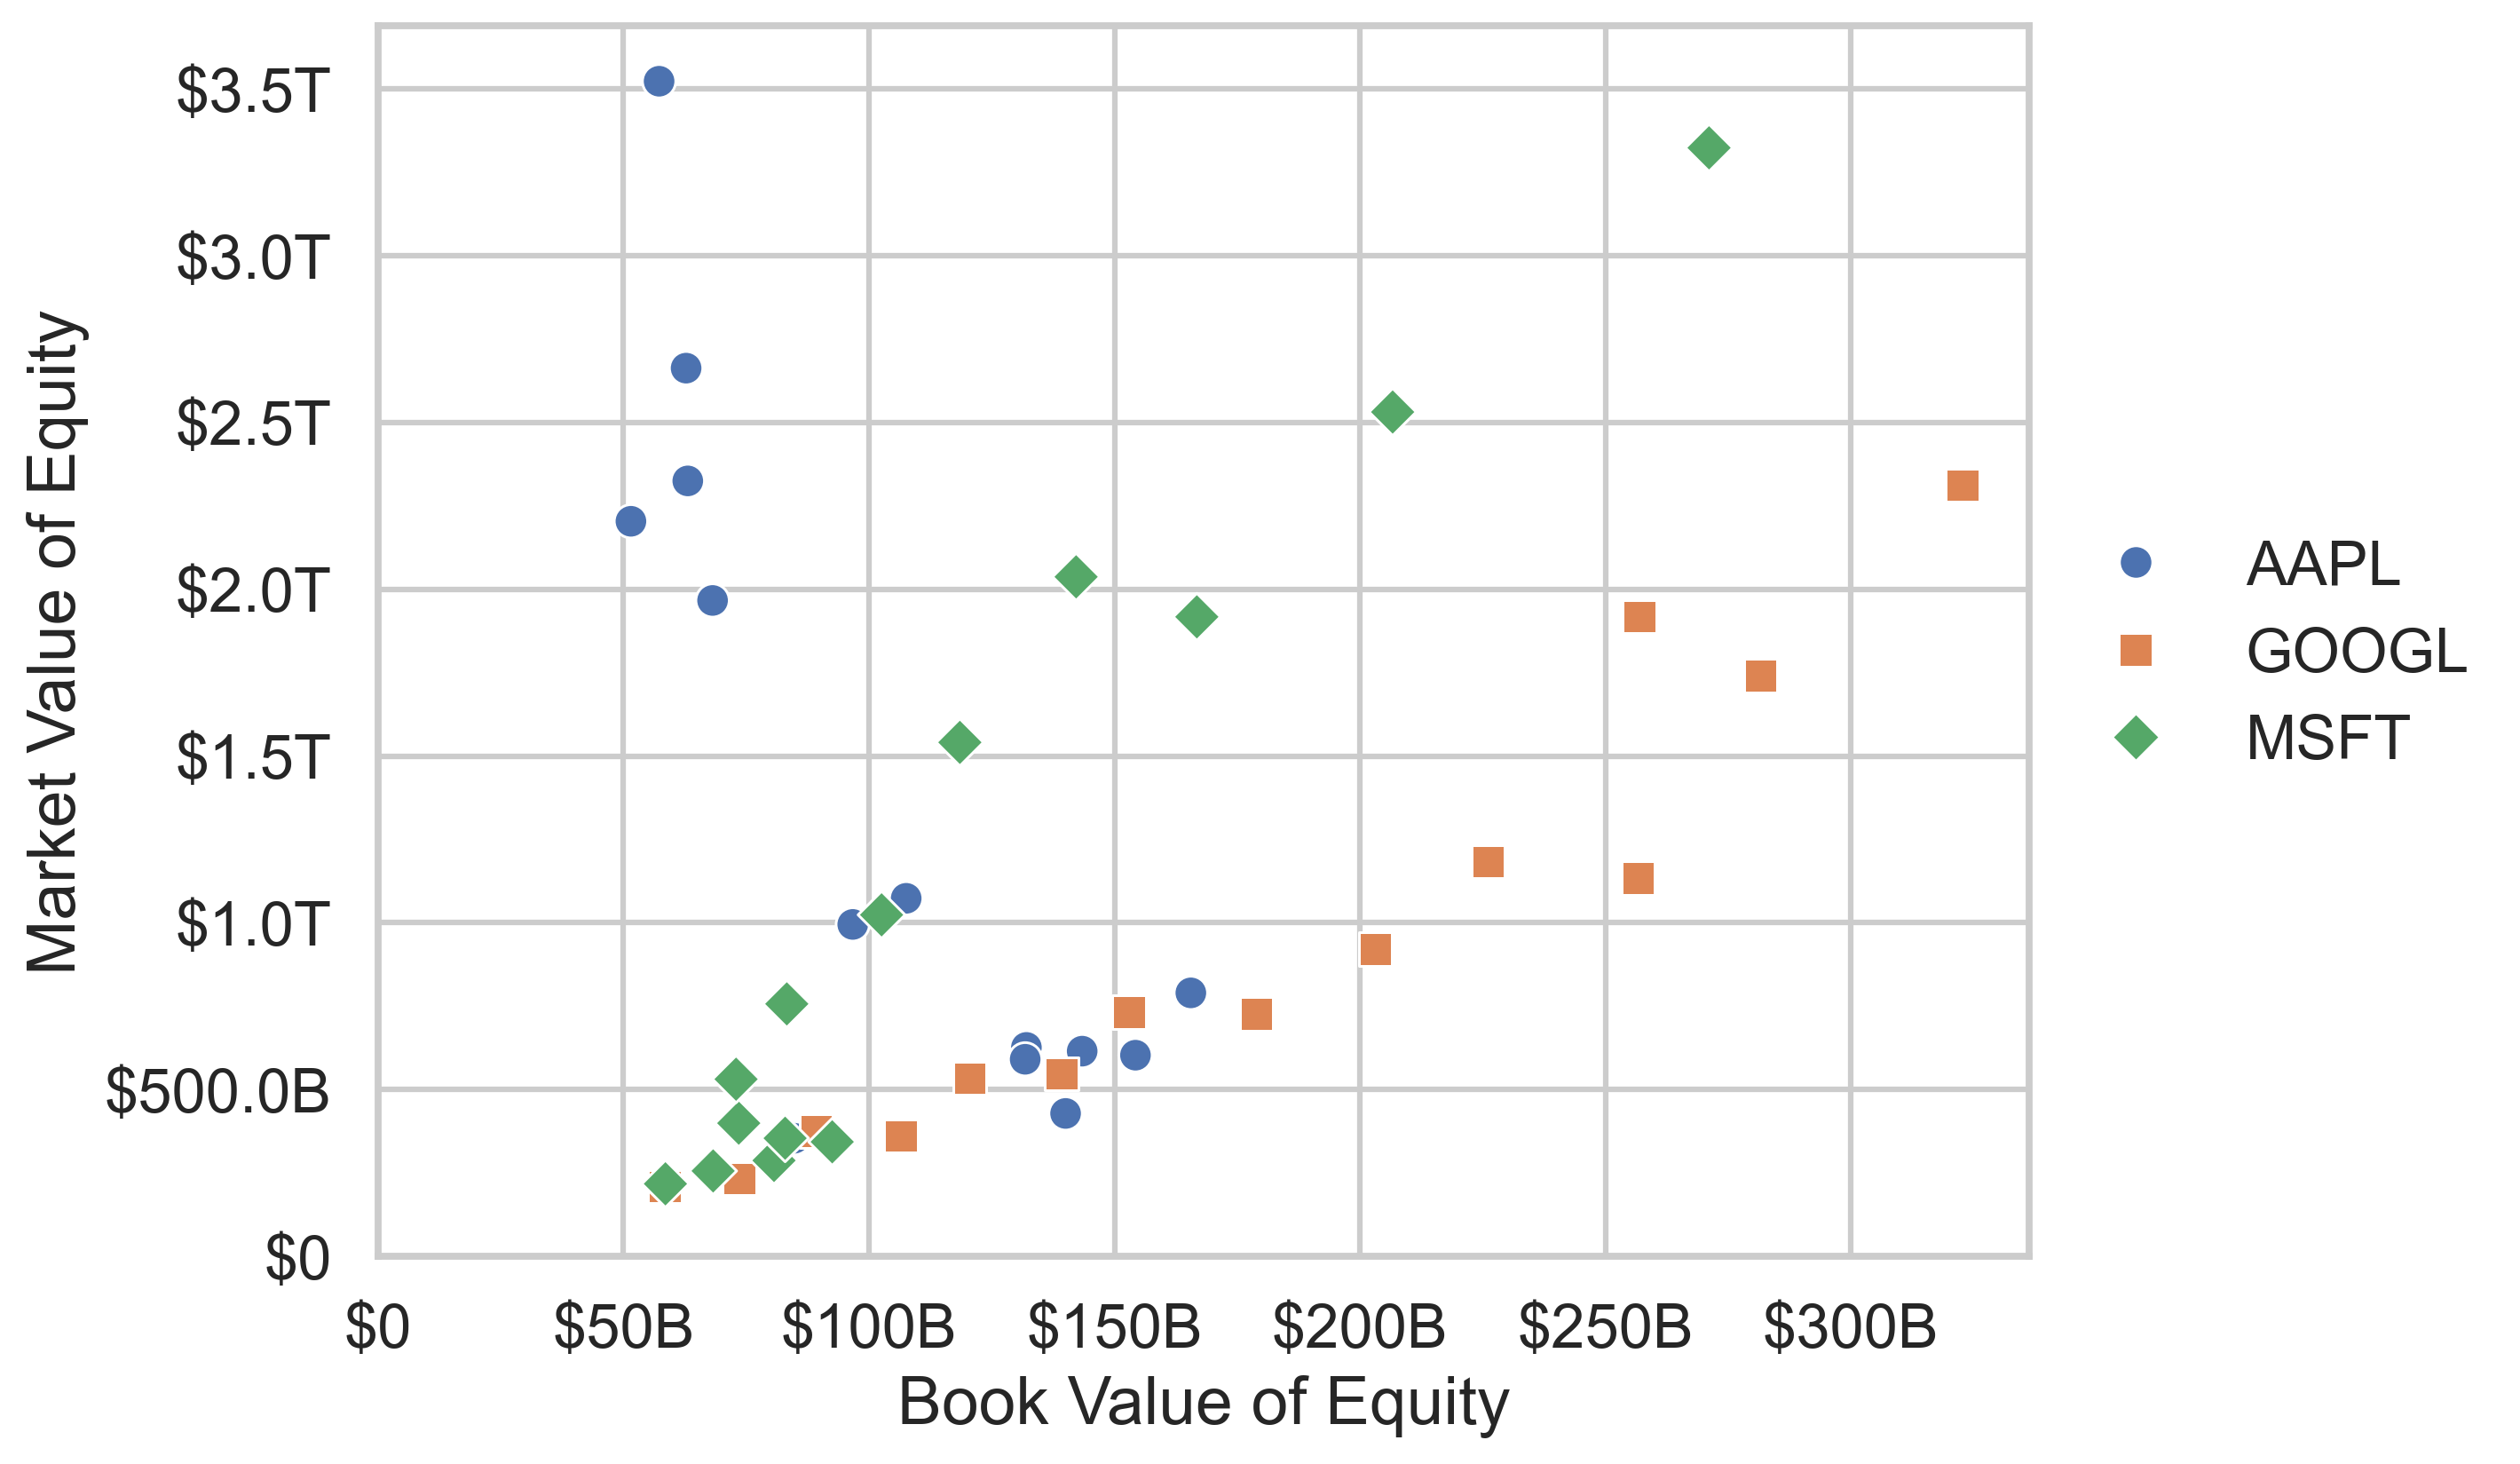
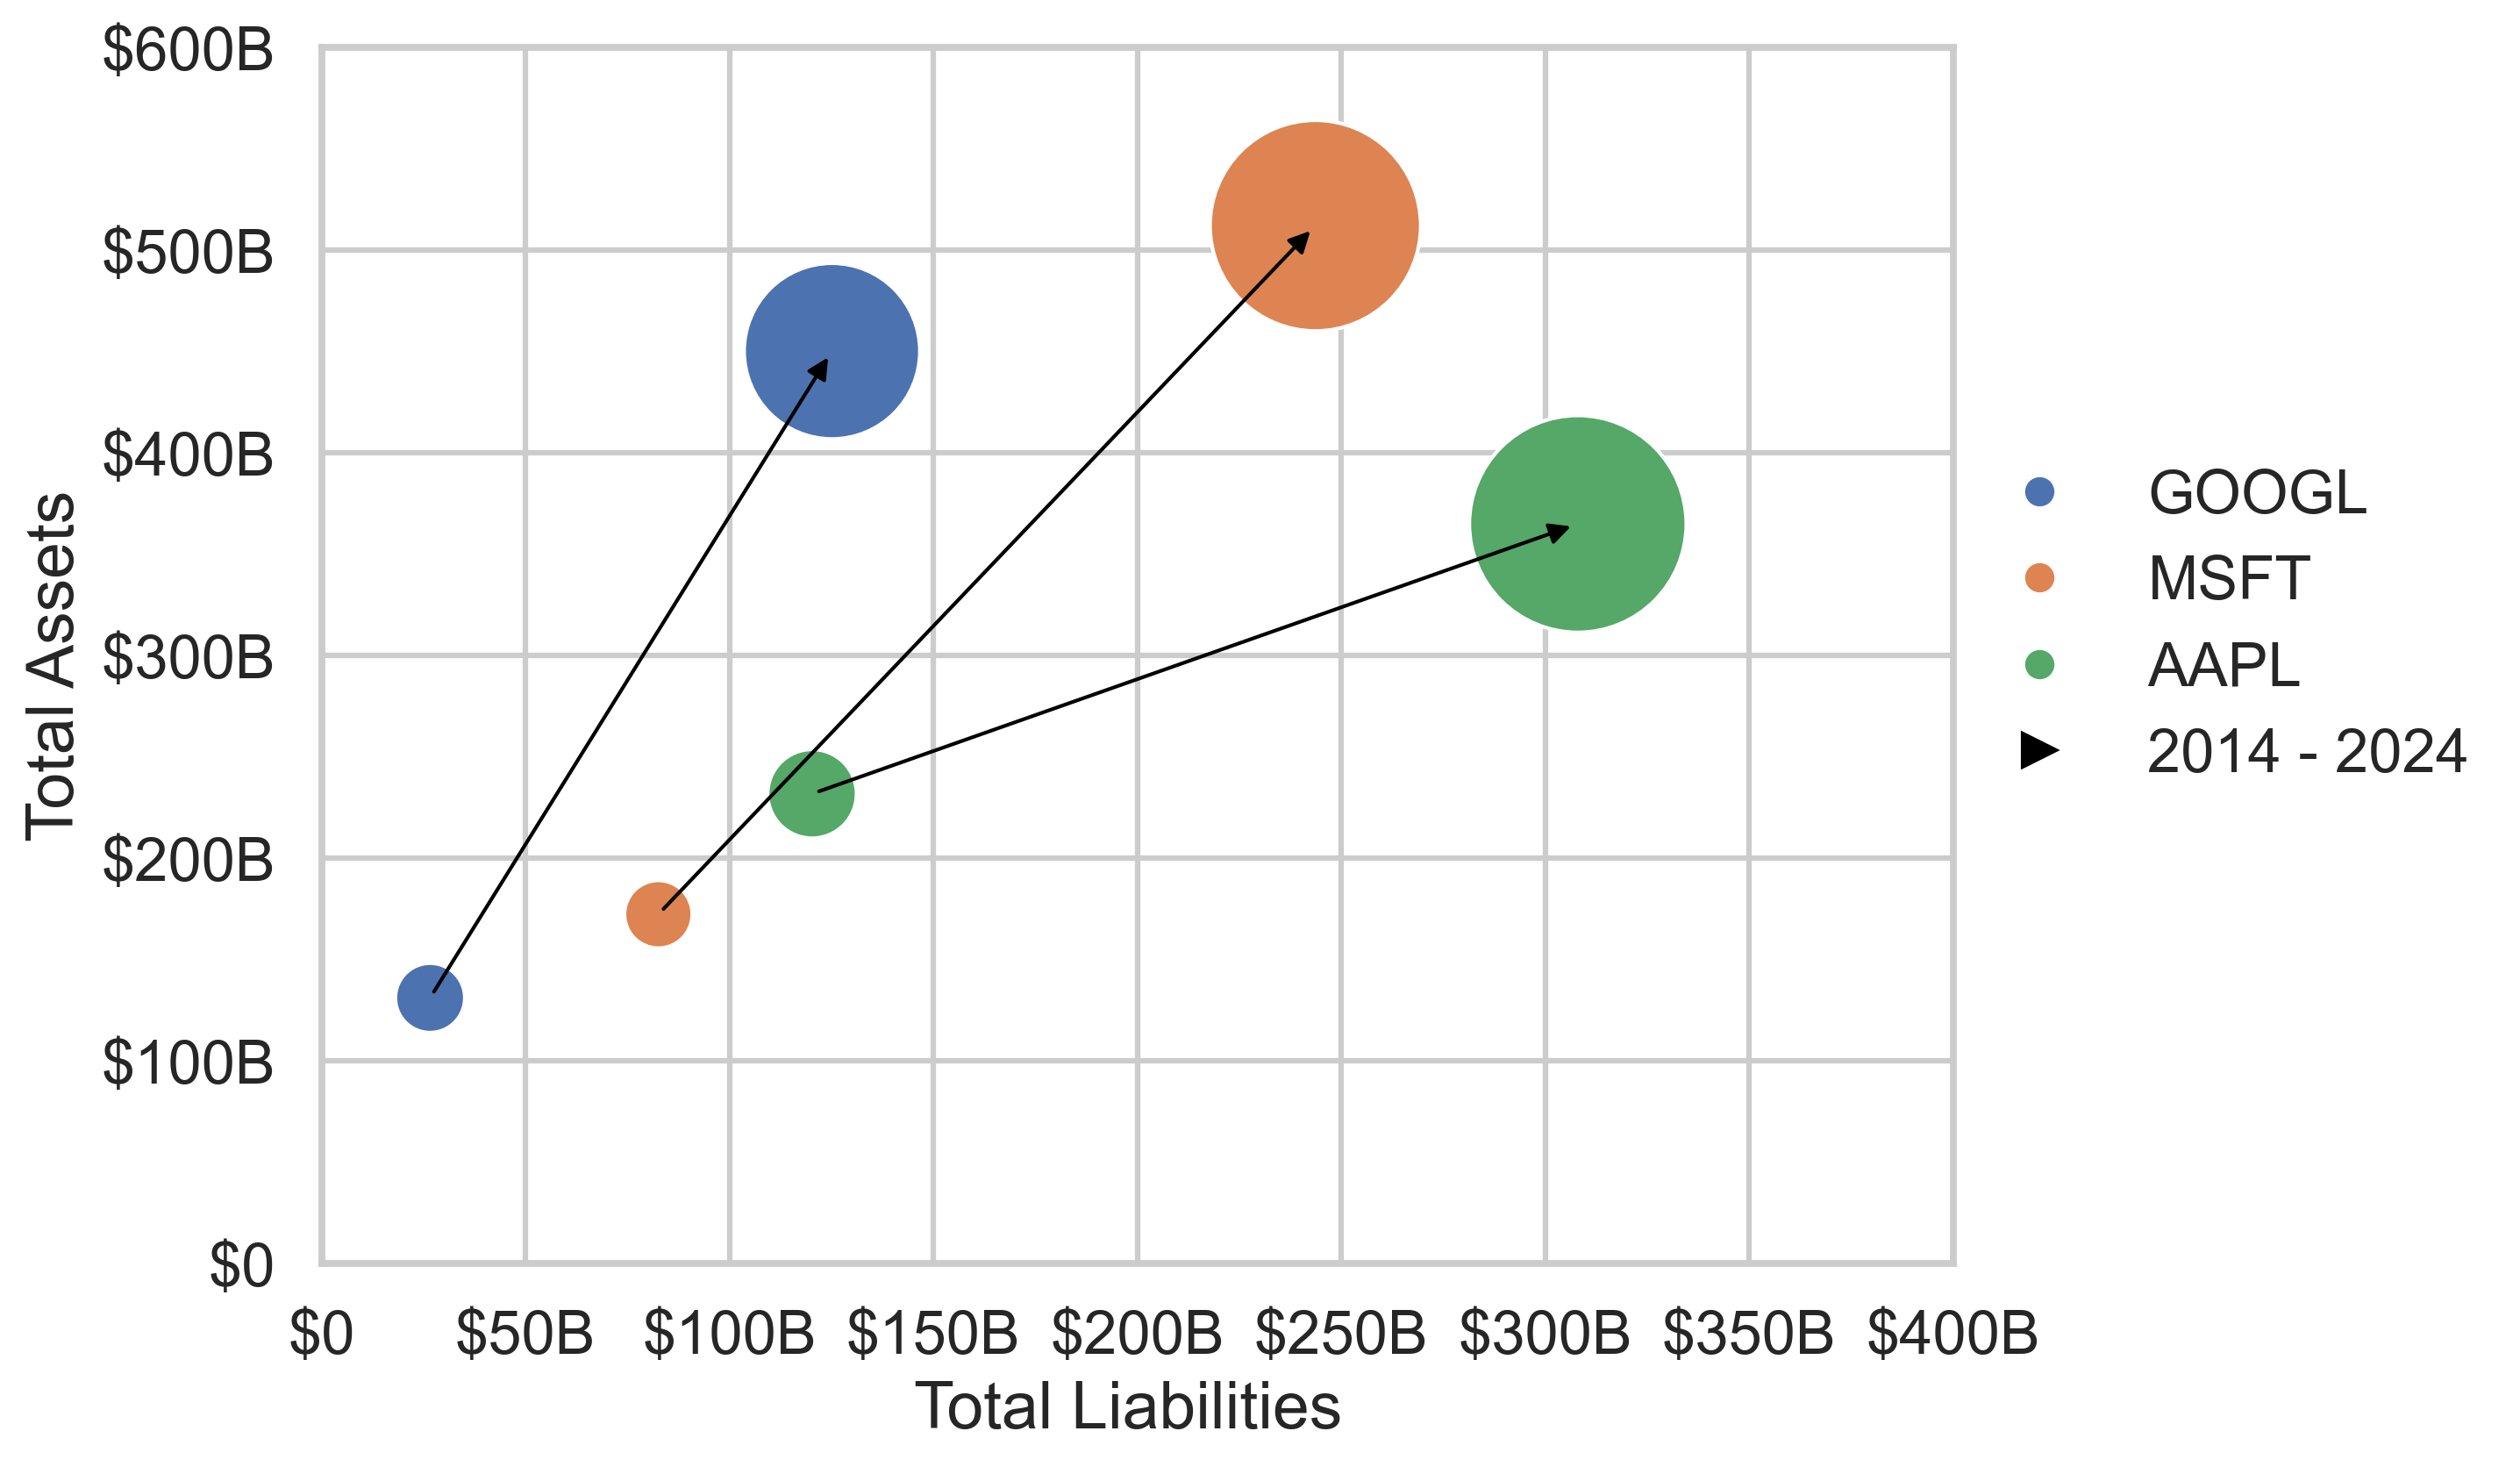
- Visualization of three or more dimensions is difficult
- 3D graphs can be hard to interpret without interactivity
- Other features can be introduced (bubble size, color, etc.) but are less self-explanatory and more complex
- Interactive visualizations can help by giving audience control over what they viewing
- Can swap between dimensions being observed
- Can incorporate time / motion
3D Example – 2D + categories
4D Example – 2D + Time + Size
Interactive Visualization
- Software to interact with data in predetermined ways
- Set of parameters to adjust, visualization updates accordingly
- Often web-based
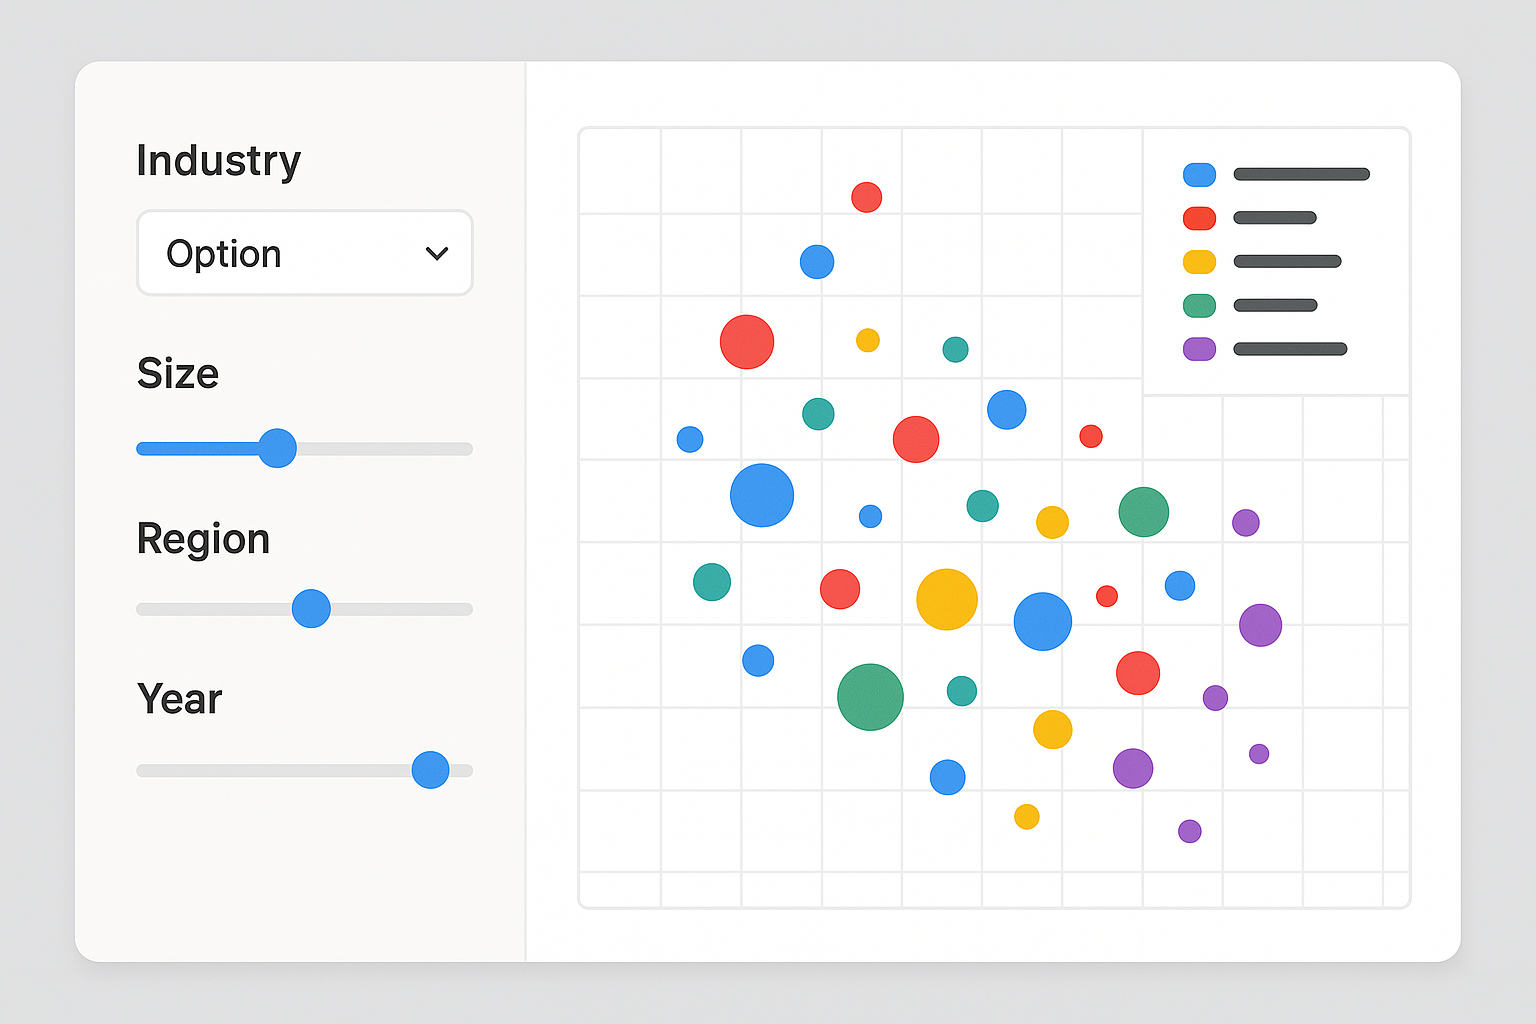
LLM/LMM Tangent
- Prompted Sora for dashboard with interactive elements
- Follow up prompt asking for added trendline
Caveats and Pitfalls
- Overfitting – Insight found during EDA should be understood to be potentially limited to the specific “pull” of the dataset
- Understand conditions of data to determine generalizability
- Multicollinearity – highly correlated variablesidentified by EDA may be problematic in subsequentmodeling or testing
Example
- You are given transaction data for a month
- Date, Amount, Payee, Category, Vendor, Notes, Approver
- Look at data
- Columns, data types, missing values, etc.
- Five-number analysis
- Initial plots
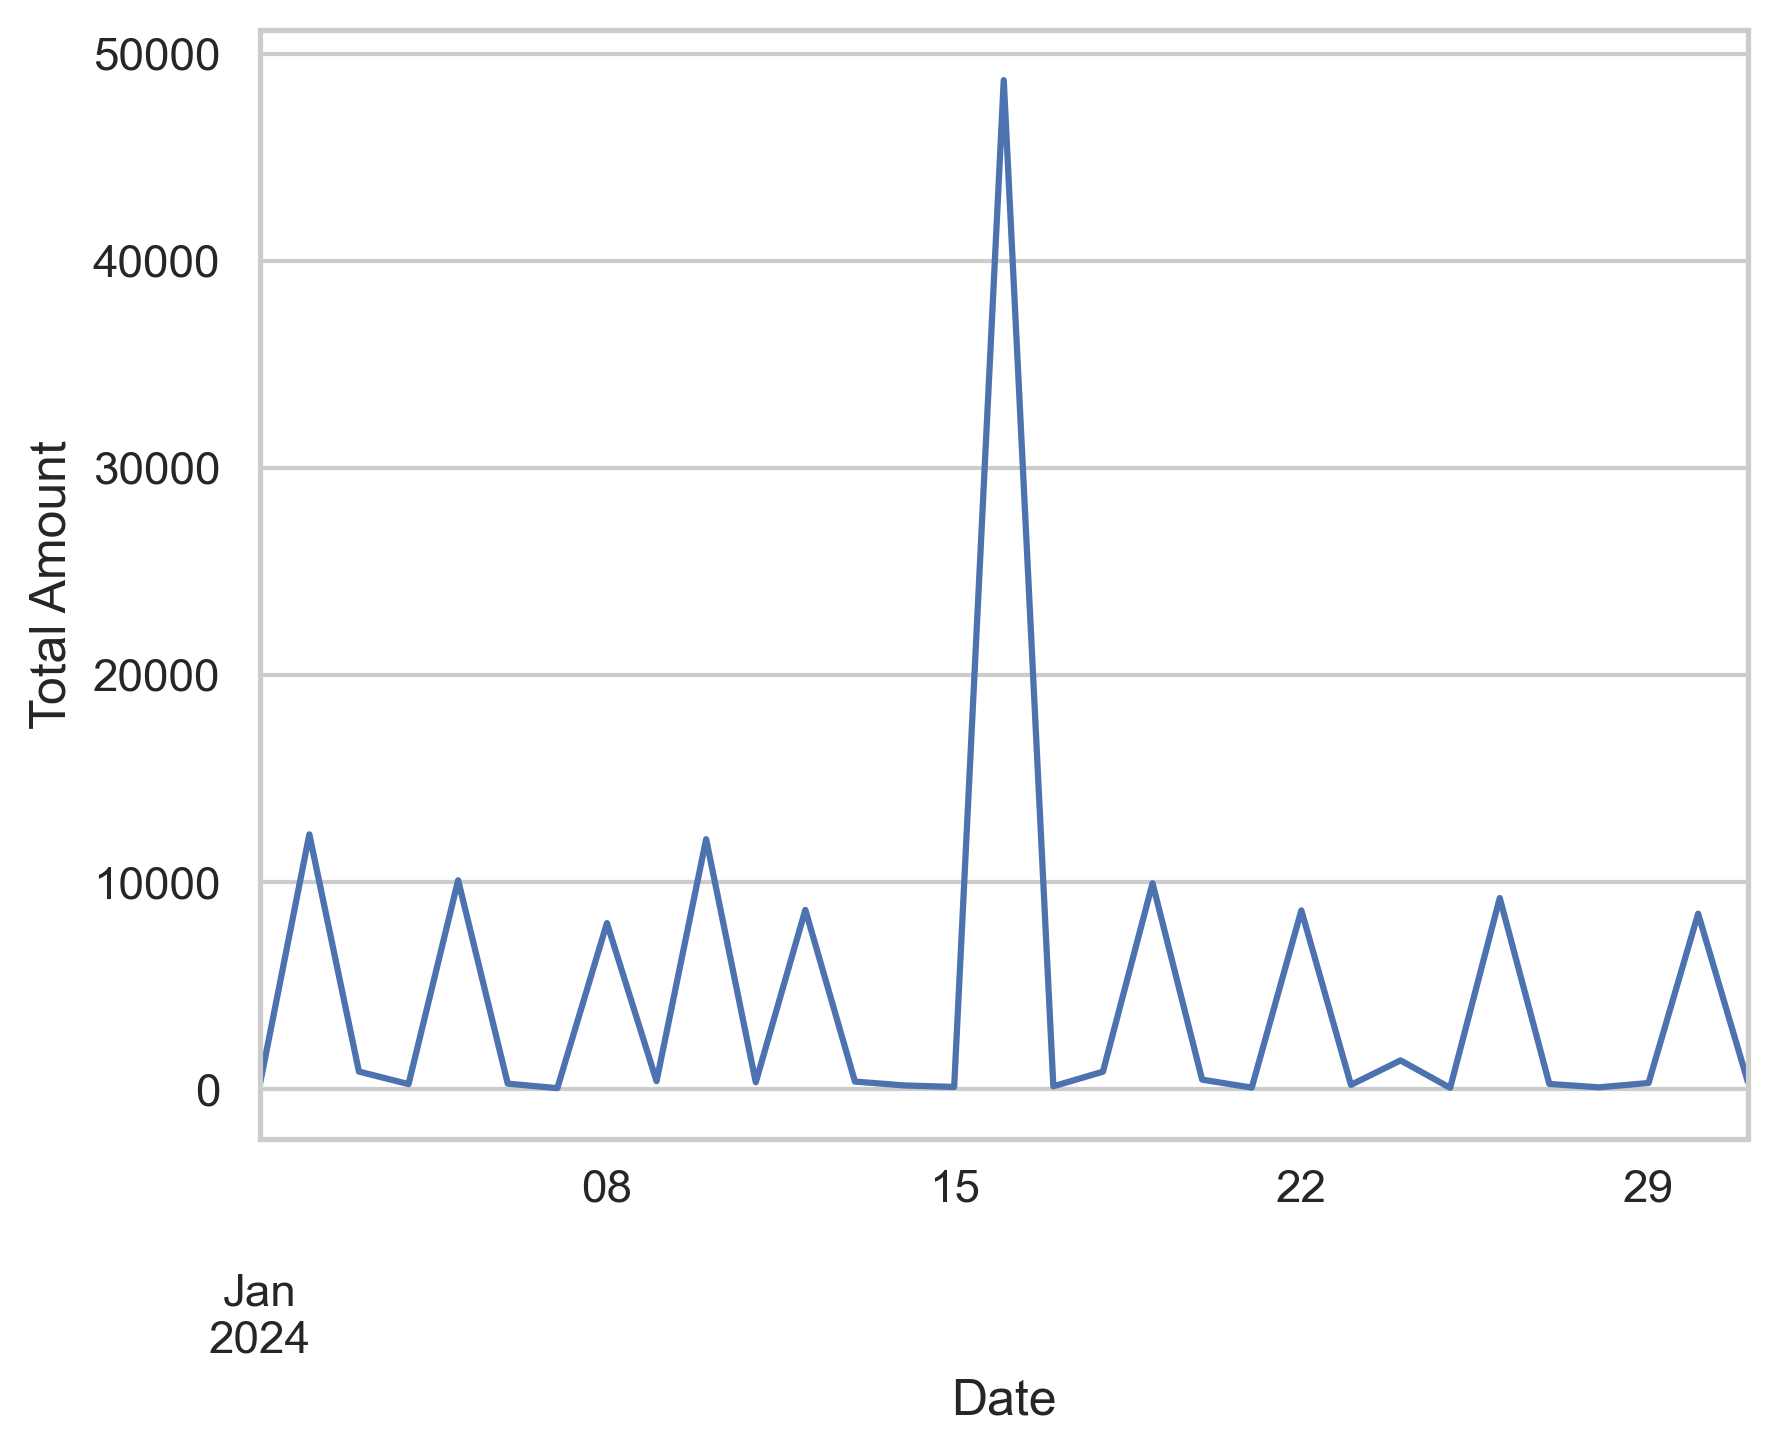
- Line plot of amount over time (Date)
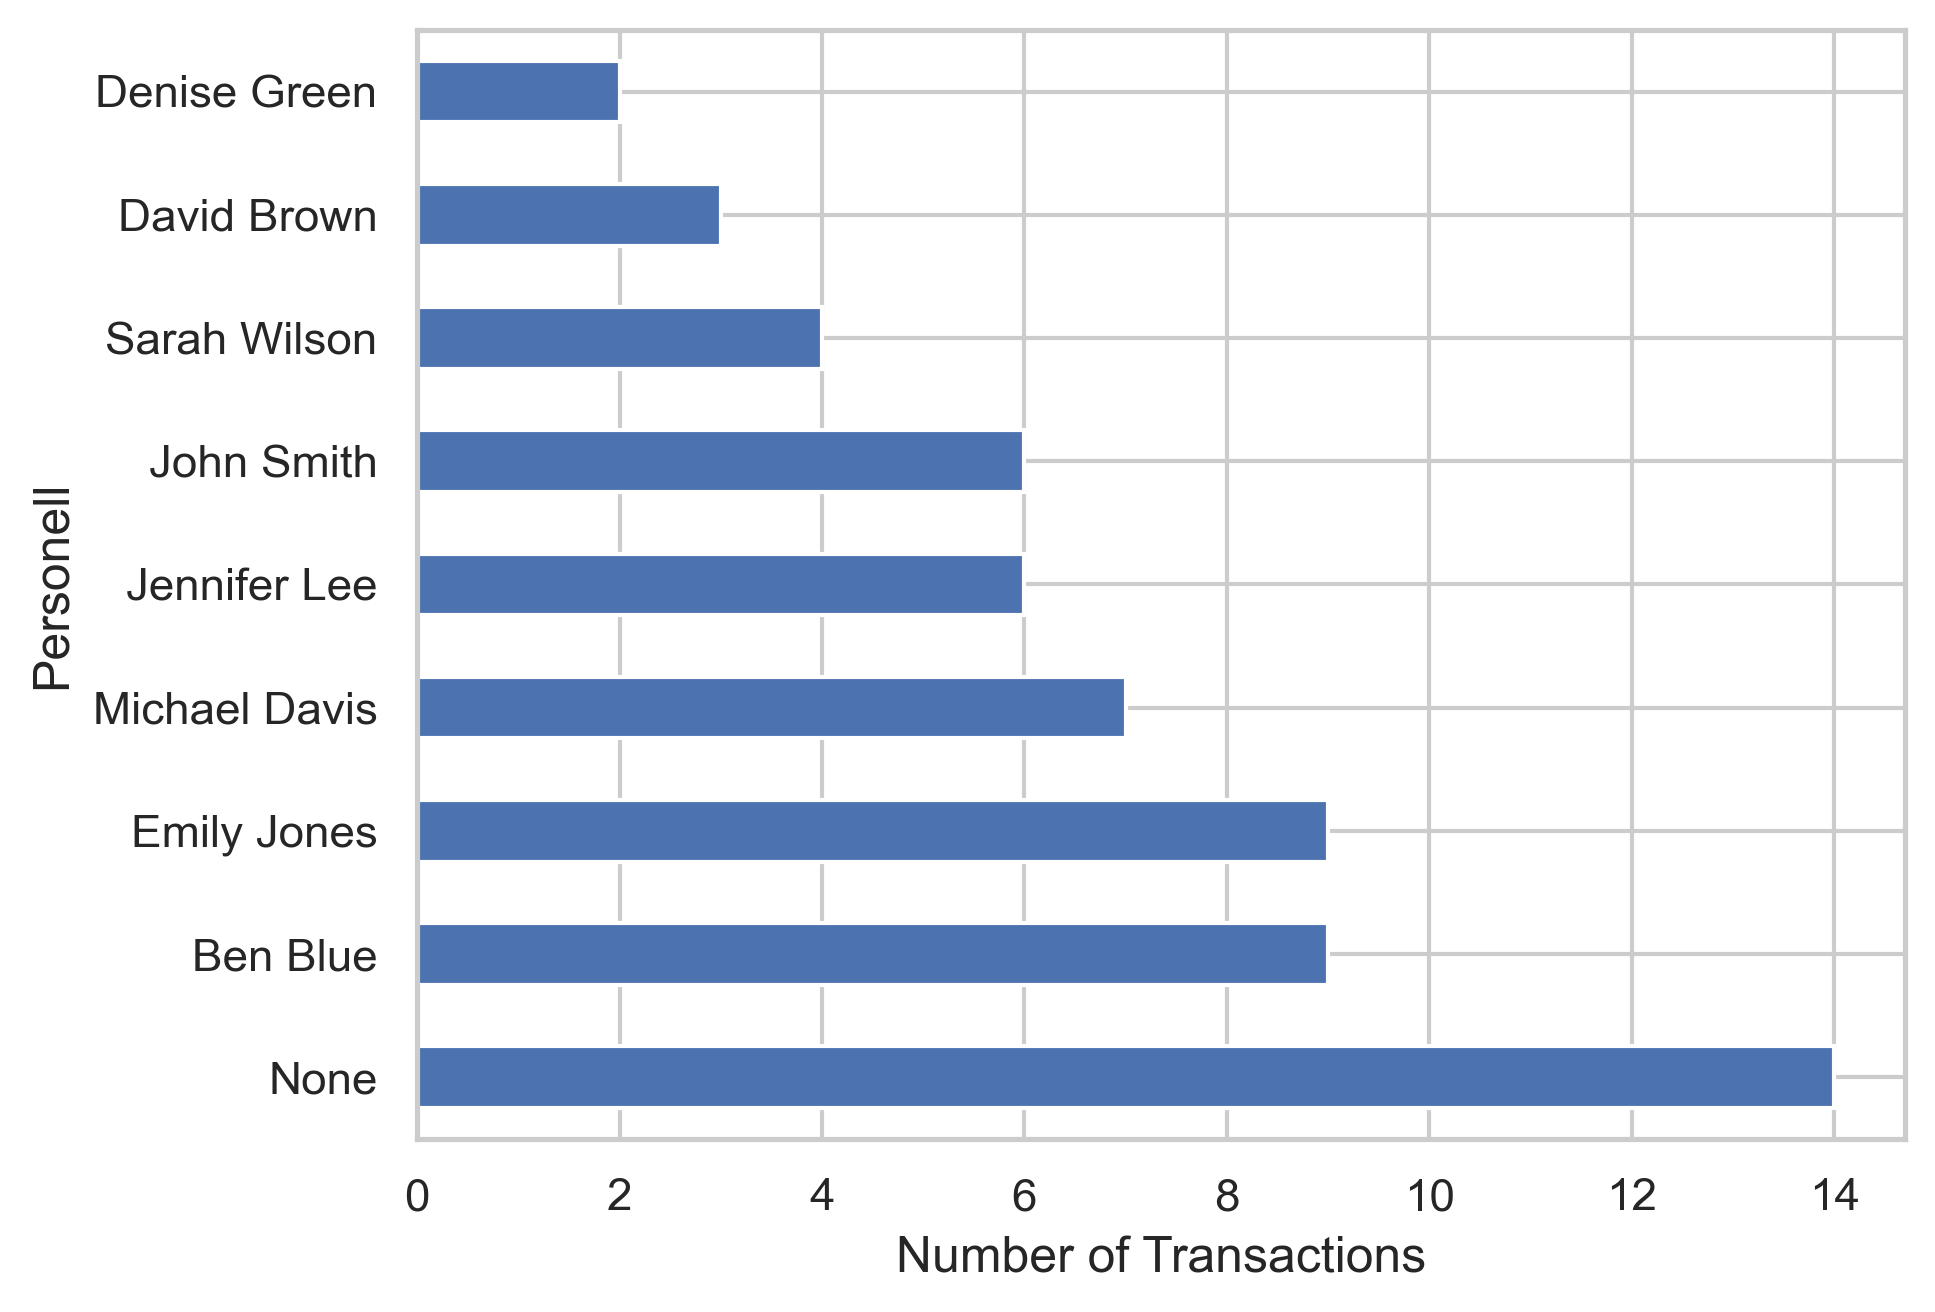
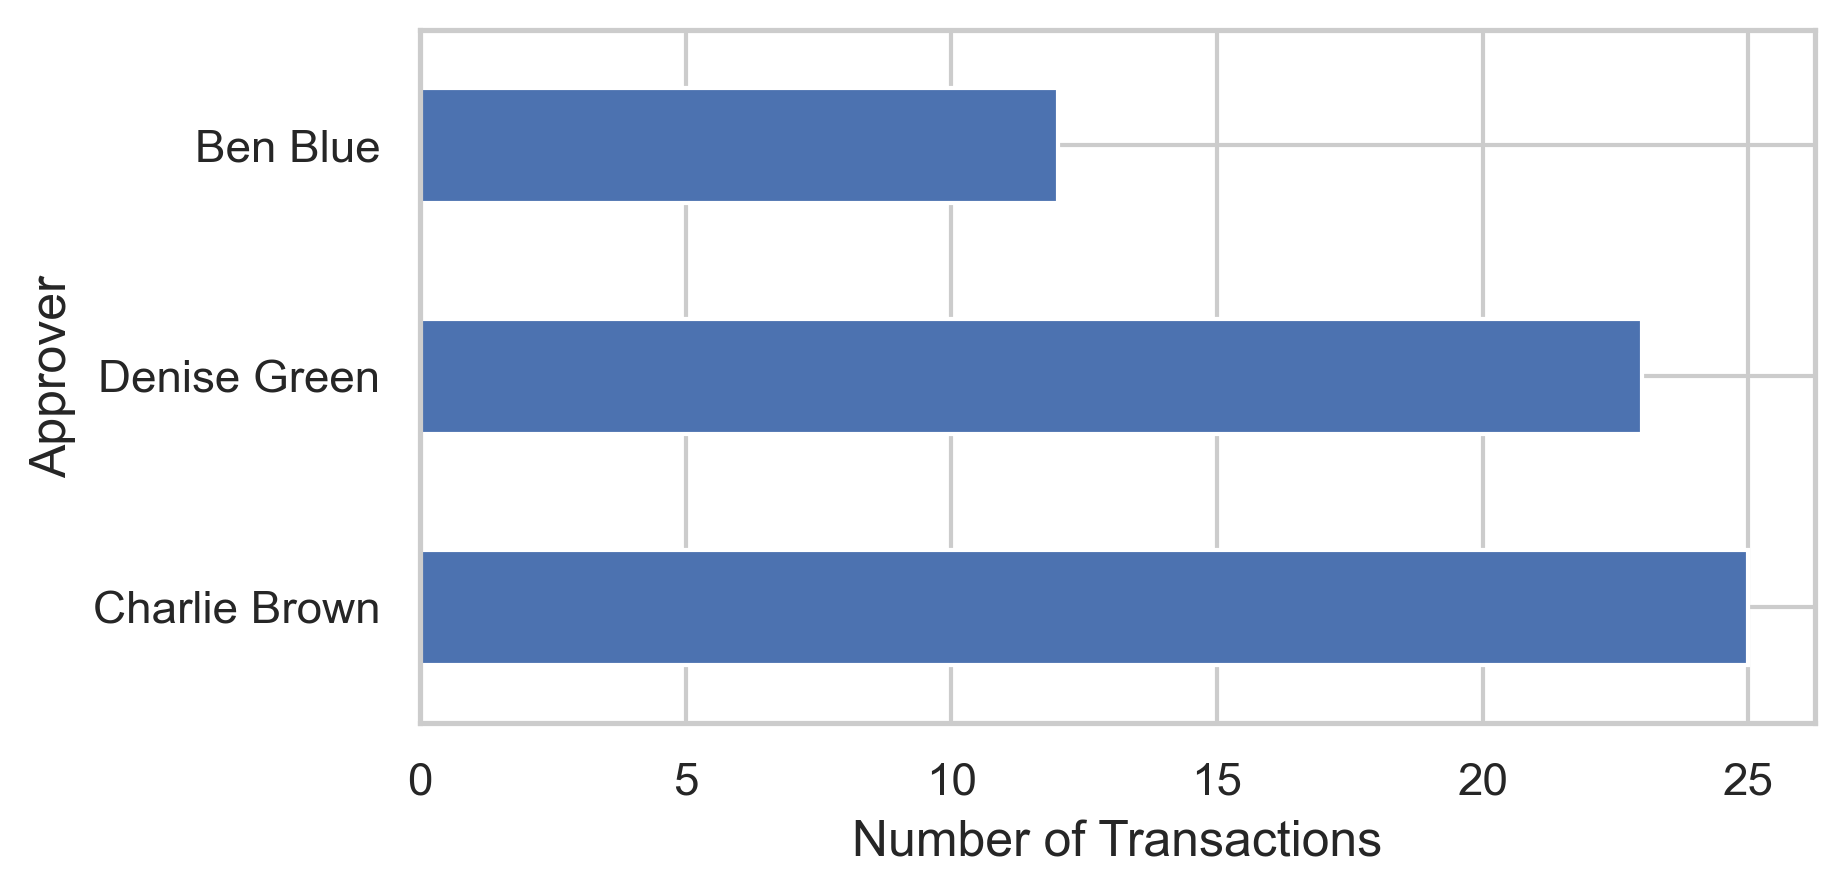
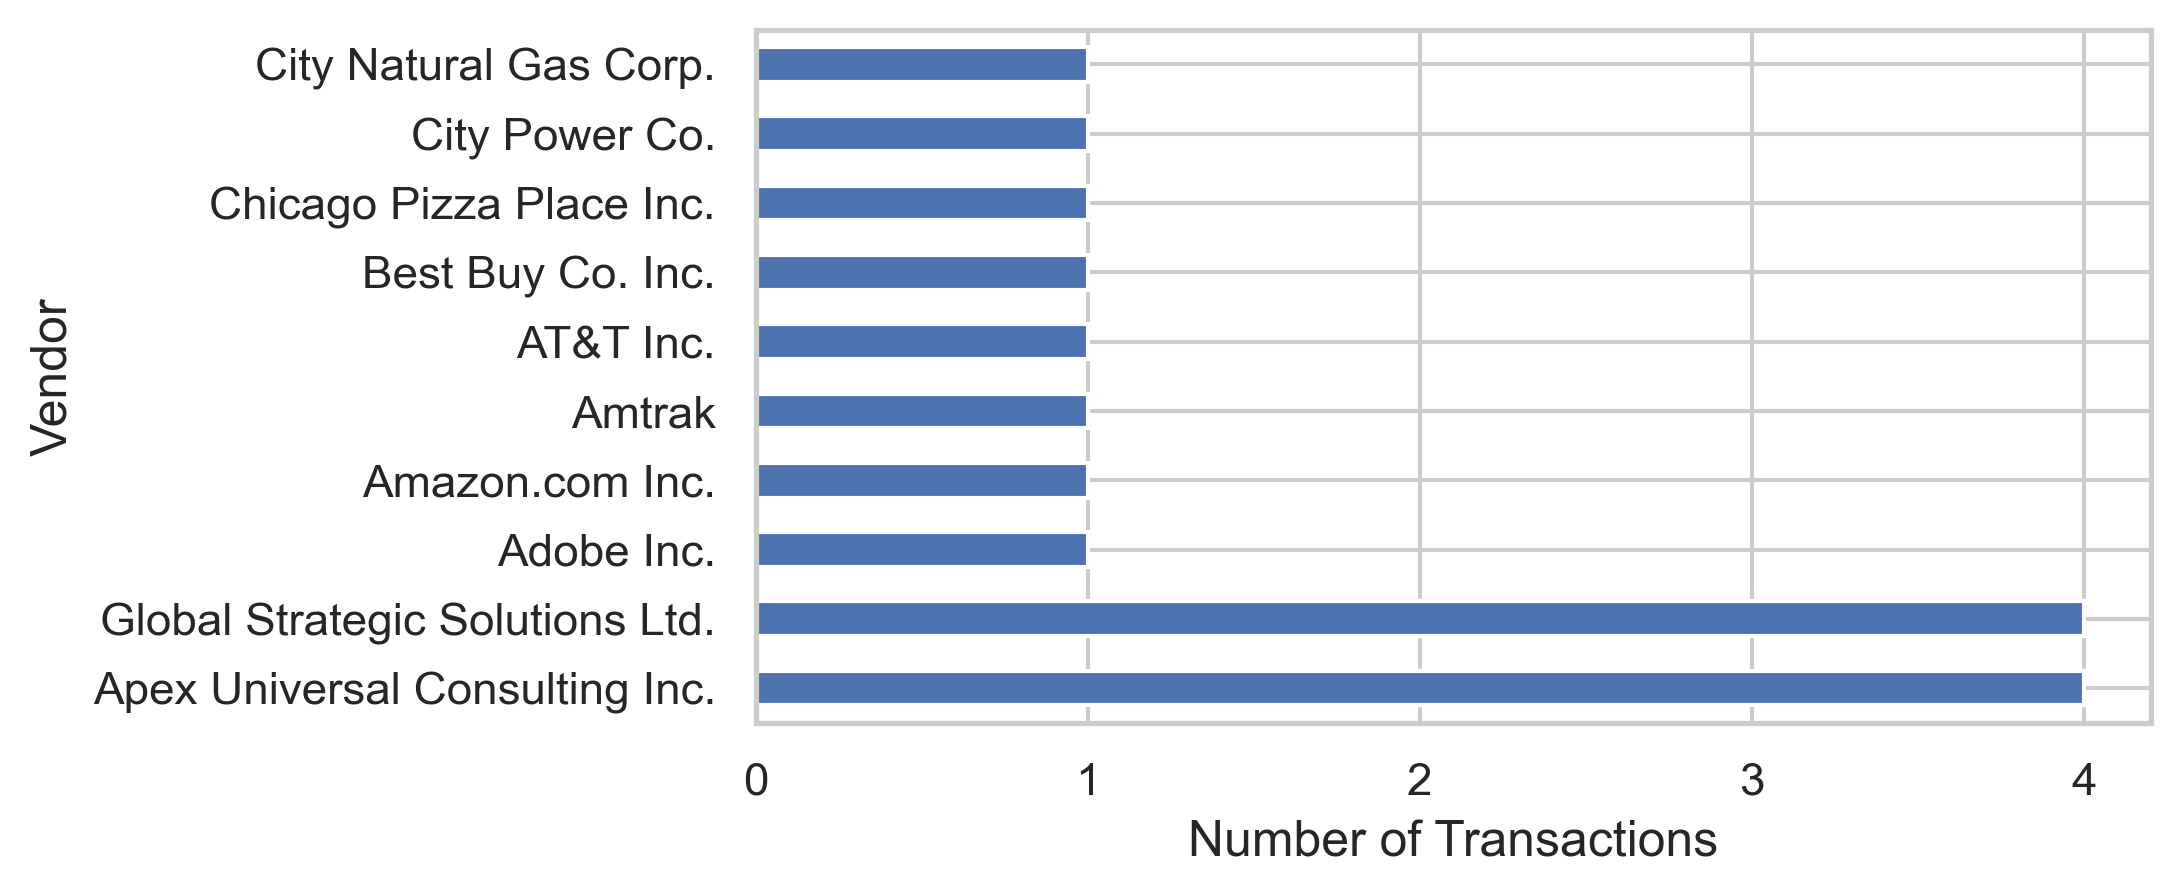
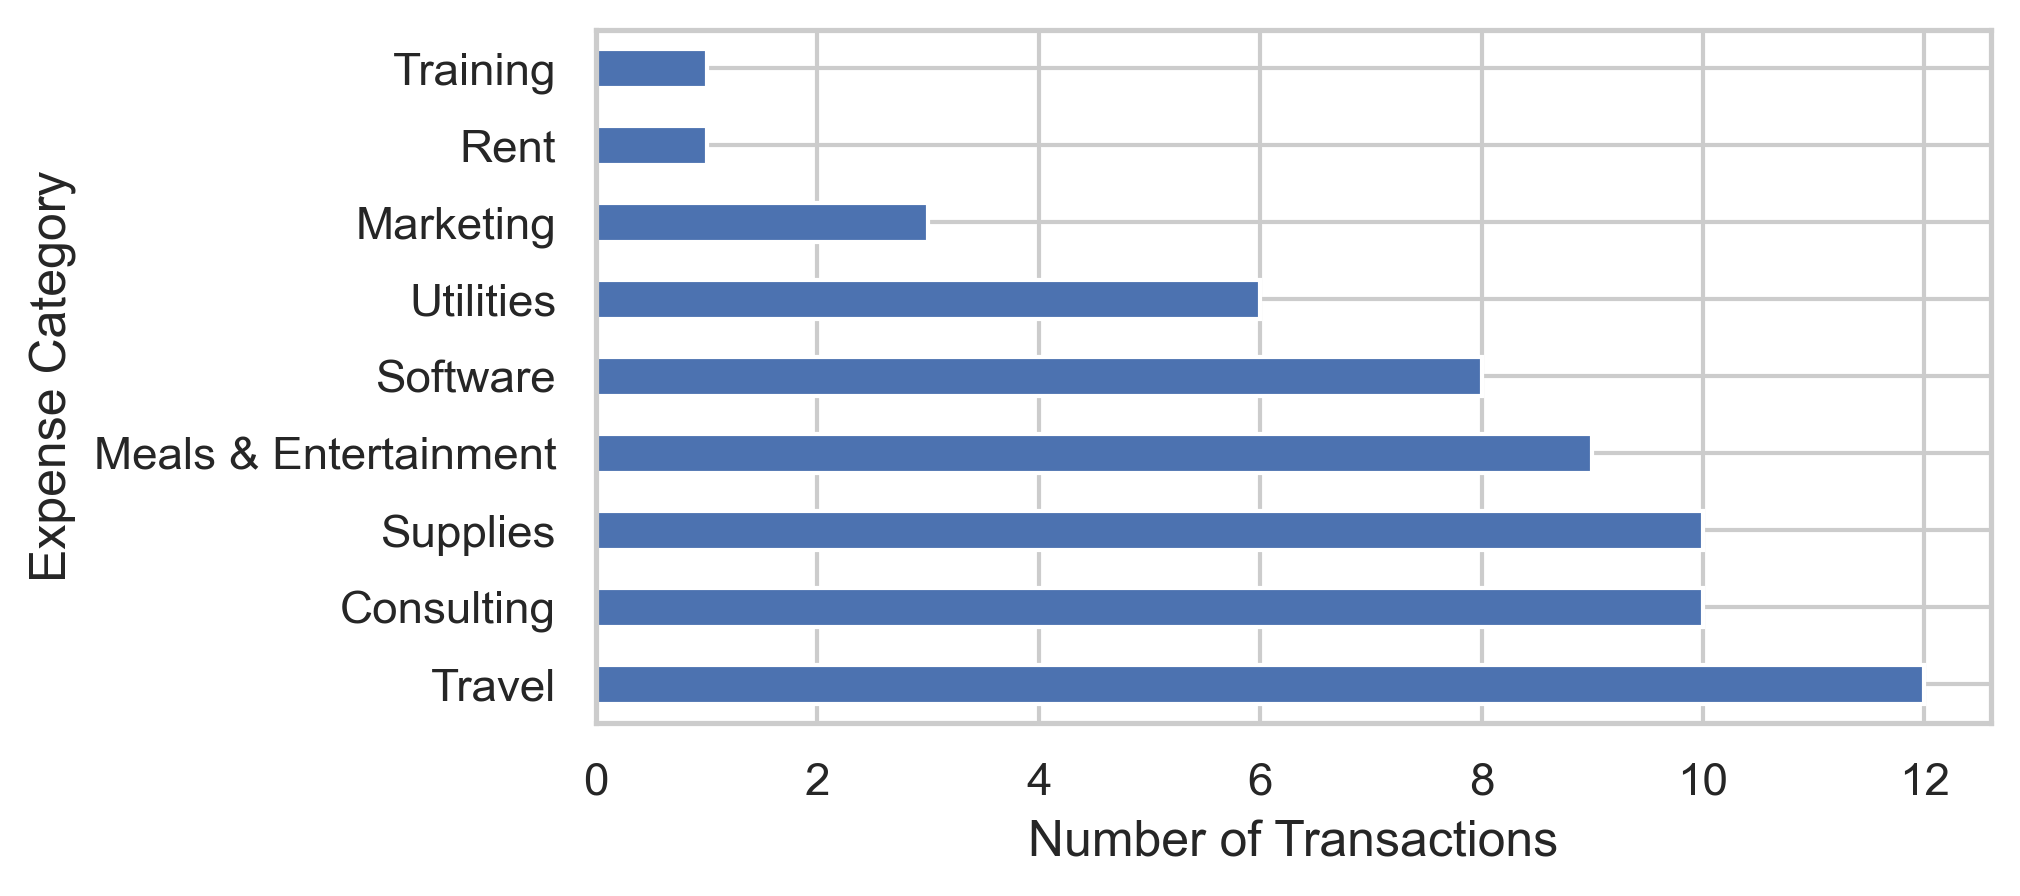
- Bar chart of count by payee, vendor, approver
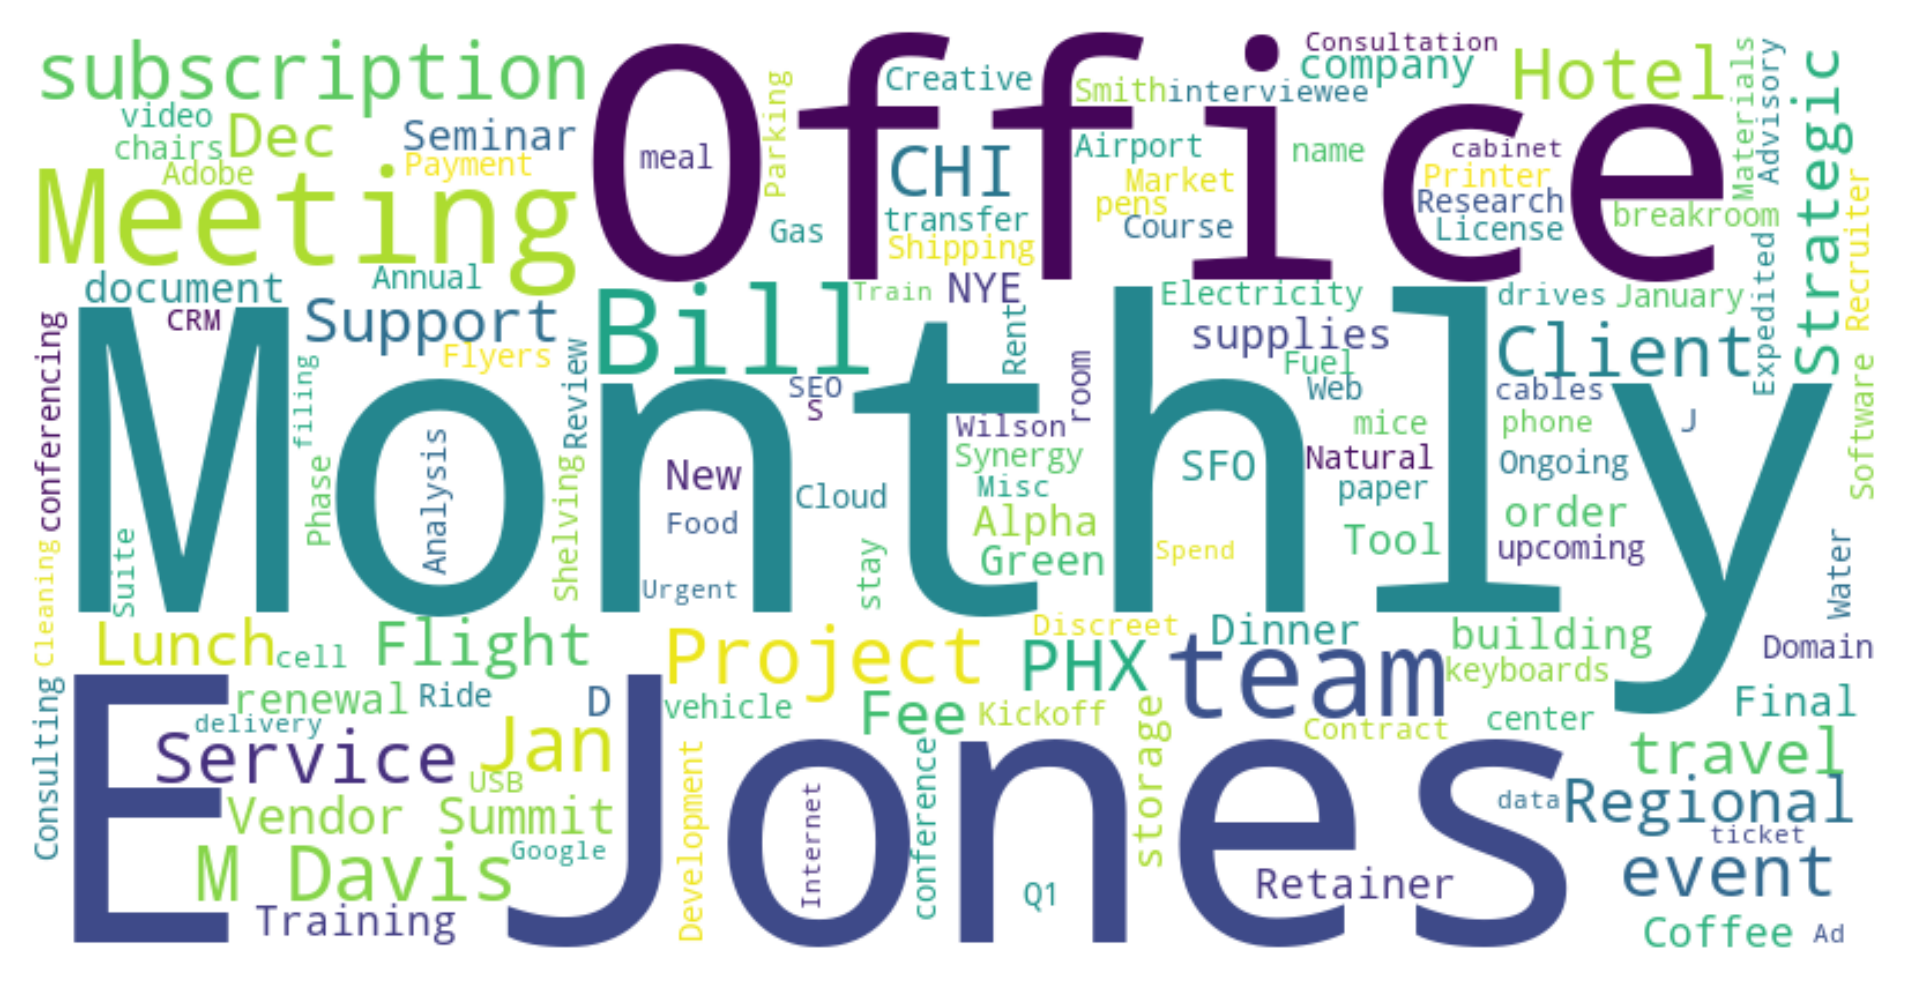
- Word-cloud of Category and Notes
The Data
| Date | Amount | Personell | Vendor | Notes | Expense_Category | Approver |
|---|---|---|---|---|---|---|
| 2024-01-10 | 12,000 | Ben Blue | Innovate Solutions Group LLC | Synergy Project Kickoff Fee | Consulting | Ben Blue |
| 2024-01-02 | 12,150 | Corporate Realty Partners LLC | January 2024 Office Rent | Rent | Charlie Brown | |
| 2024-01-15 | 41,534 | Jennifer Lee | Internal Transfer / Payroll Service | Salary payment Jan 1-15 | Salaries | Charlie Brown |
| 2024-01-25 | 41,582 | David Brown | Internal Transfer / Payroll Service | Salary payment Jan 16-31 | Salaries | Charlie Brown |
| 2024-01-16 | 48,500 | Ben Blue | Apex Universal Consulting Inc. | Market Research Analysis Q1 | Consulting | Ben Blue |
Familiarization with the data
- Understanding the broader context of the data
- Where did it come from?
- How was it collected?
- Are there known limitations or potential biases in the collection process?
- This is where your accounting knowledge is key
Familiarization with the specific data
- Understanding the dataset at hand
- What do the variables represent?
- What contextual information should be incorporated into understanding this data?
- Is more data needed before use (merging)?
Initial Inspection
- Examine the dataset’s dimensions (# of rows and columns)
- Identify the data types of each variable
- numerical continuous/discrete, categorical nominal/ordinal, date/time, text short/long
- View rows of data to get a sense of the content and structure
- Identify “special” columns like merge keys, unique IDs
- Identify how missing observations are represented
- Identify whether variables have default values
- Investigate whether and how missings can be filled/imputed
- Identify whether duplicates exist and can be removed
Look at data
| Date | Amount | Personell | Vendor | Notes | Expense_Category | Approver |
|---|---|---|---|---|---|---|
| 2024-01-10 | 12,000 | Ben Blue | Innovate Solutions Group LLC | Synergy Project Kickoff Fee | Consulting | Ben Blue |
| 2024-01-02 | 12,150 | Corporate Realty Partners LLC | January 2024 Office Rent | Rent | Charlie Brown | |
| 2024-01-15 | 41,534 | Jennifer Lee | Internal Transfer / Payroll Service | Salary payment Jan 1-15 | Salaries | Charlie Brown |
| 2024-01-25 | 41,582 | David Brown | Internal Transfer / Payroll Service | Salary payment Jan 16-31 | Salaries | Charlie Brown |
| 2024-01-16 | 48,500 | Ben Blue | Apex Universal Consulting Inc. | Market Research Analysis Q1 | Consulting | Ben Blue |
| count | mean | std | min | 25% | 50% | 75% | max | |
|---|---|---|---|---|---|---|---|---|
| Date | 62 | 2024-01-15 | 2024-01-01 | 2024-01-08 | 2024-01-15 | 2024-01-23 | 2024-01-31 | |
| Amount | 62 | 3,645 | 9,762 | 11.0 | 75.8 | 157.9 | 469.3 | 48,500 |
Visual exploration
- “There is no excuse for failing to plot and look” ~ John Tukey
- Histograms: Understand the distribution of numerical variables, identify outliers
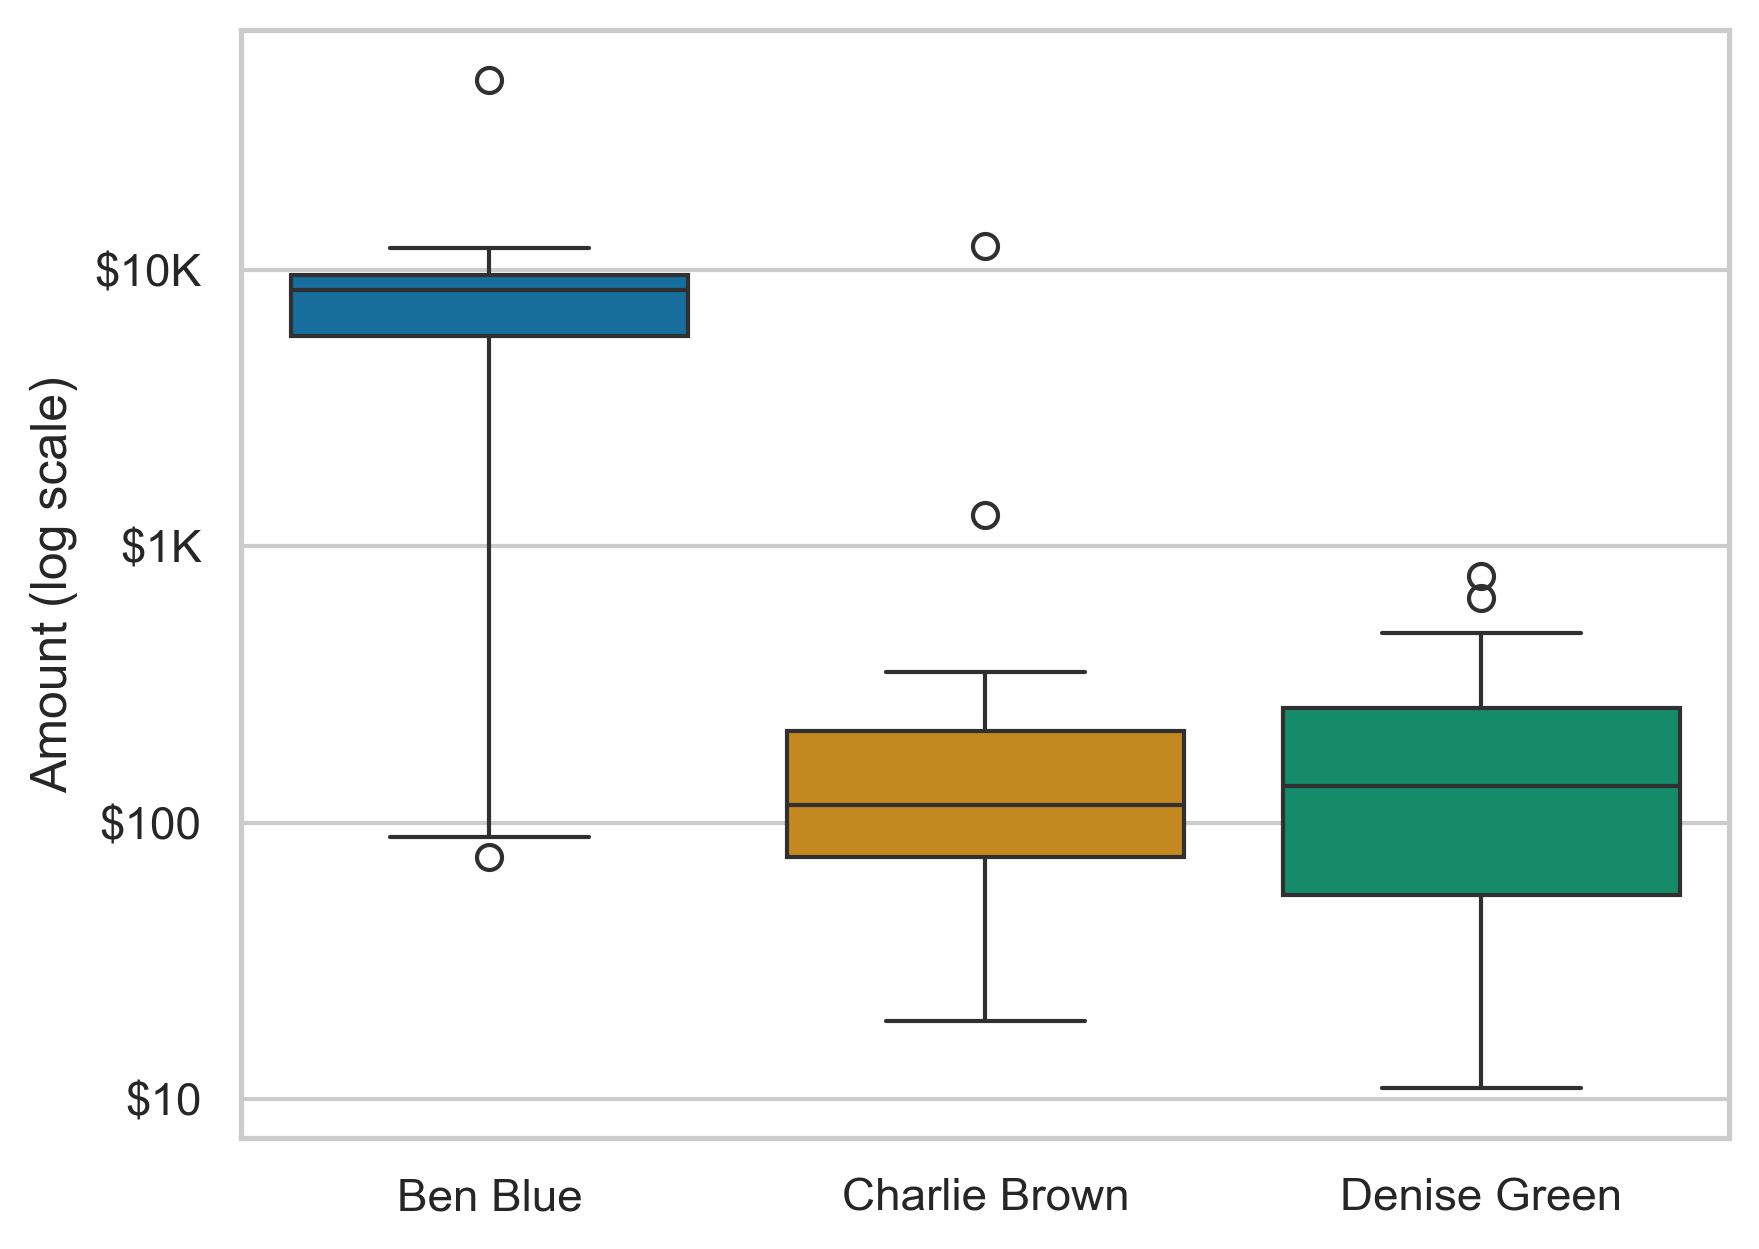
- Box Plots: Visualize the distribution, central tendency, spread, and outliers of numerical data, possibly by category
- Bar Charts: Compare categorical data
- Scatter Plots: Investigate relationships between numerical variables
- Line Charts: Show trends over time, across categories
- Heatmaps: Visualize correlation matrices, missing values, etc.
amount over time
Transactions by employee
Approvals by employee
Transactions by vendor
Transactions by expense
Note field Wordcloud
Next steps: dig deeper
- Start looking for abnormalities & outliers
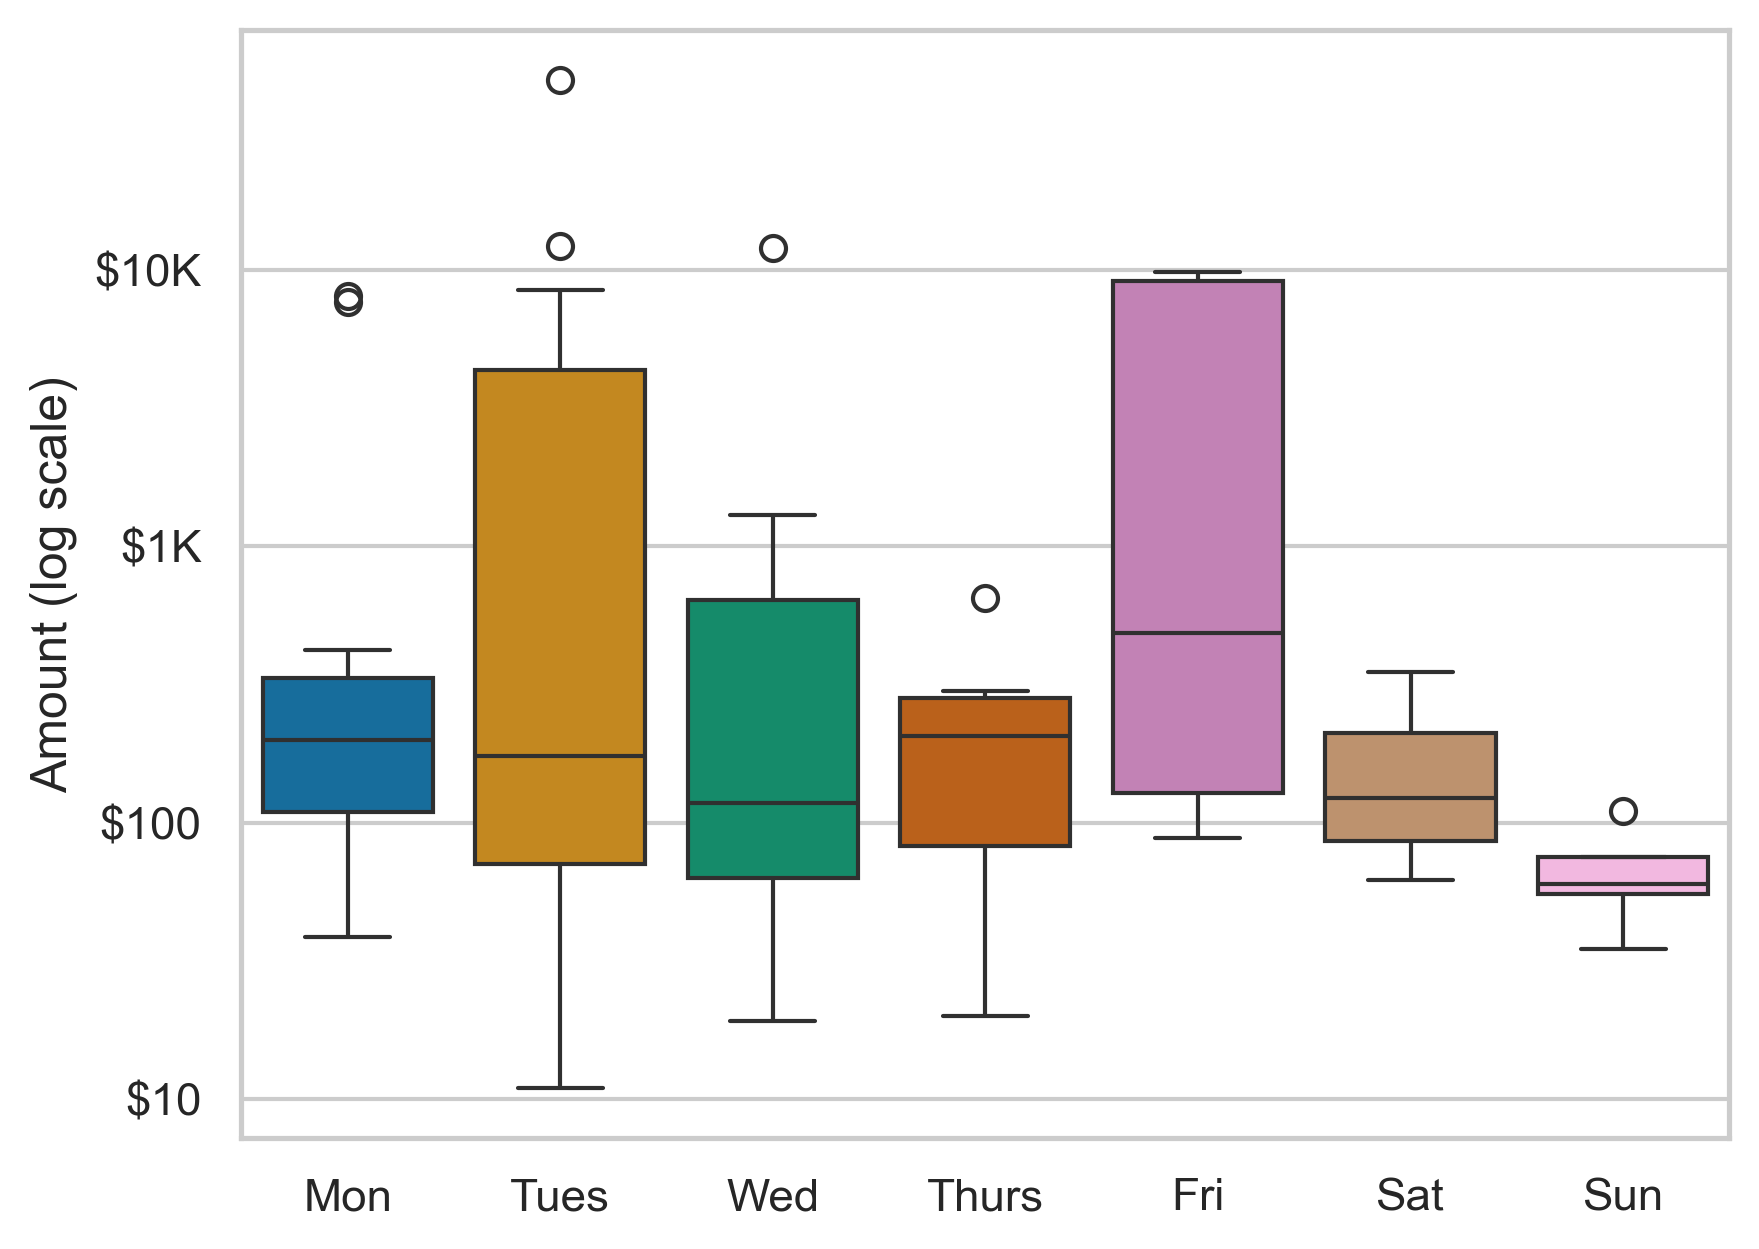
- Amounts by day of week (box plot)
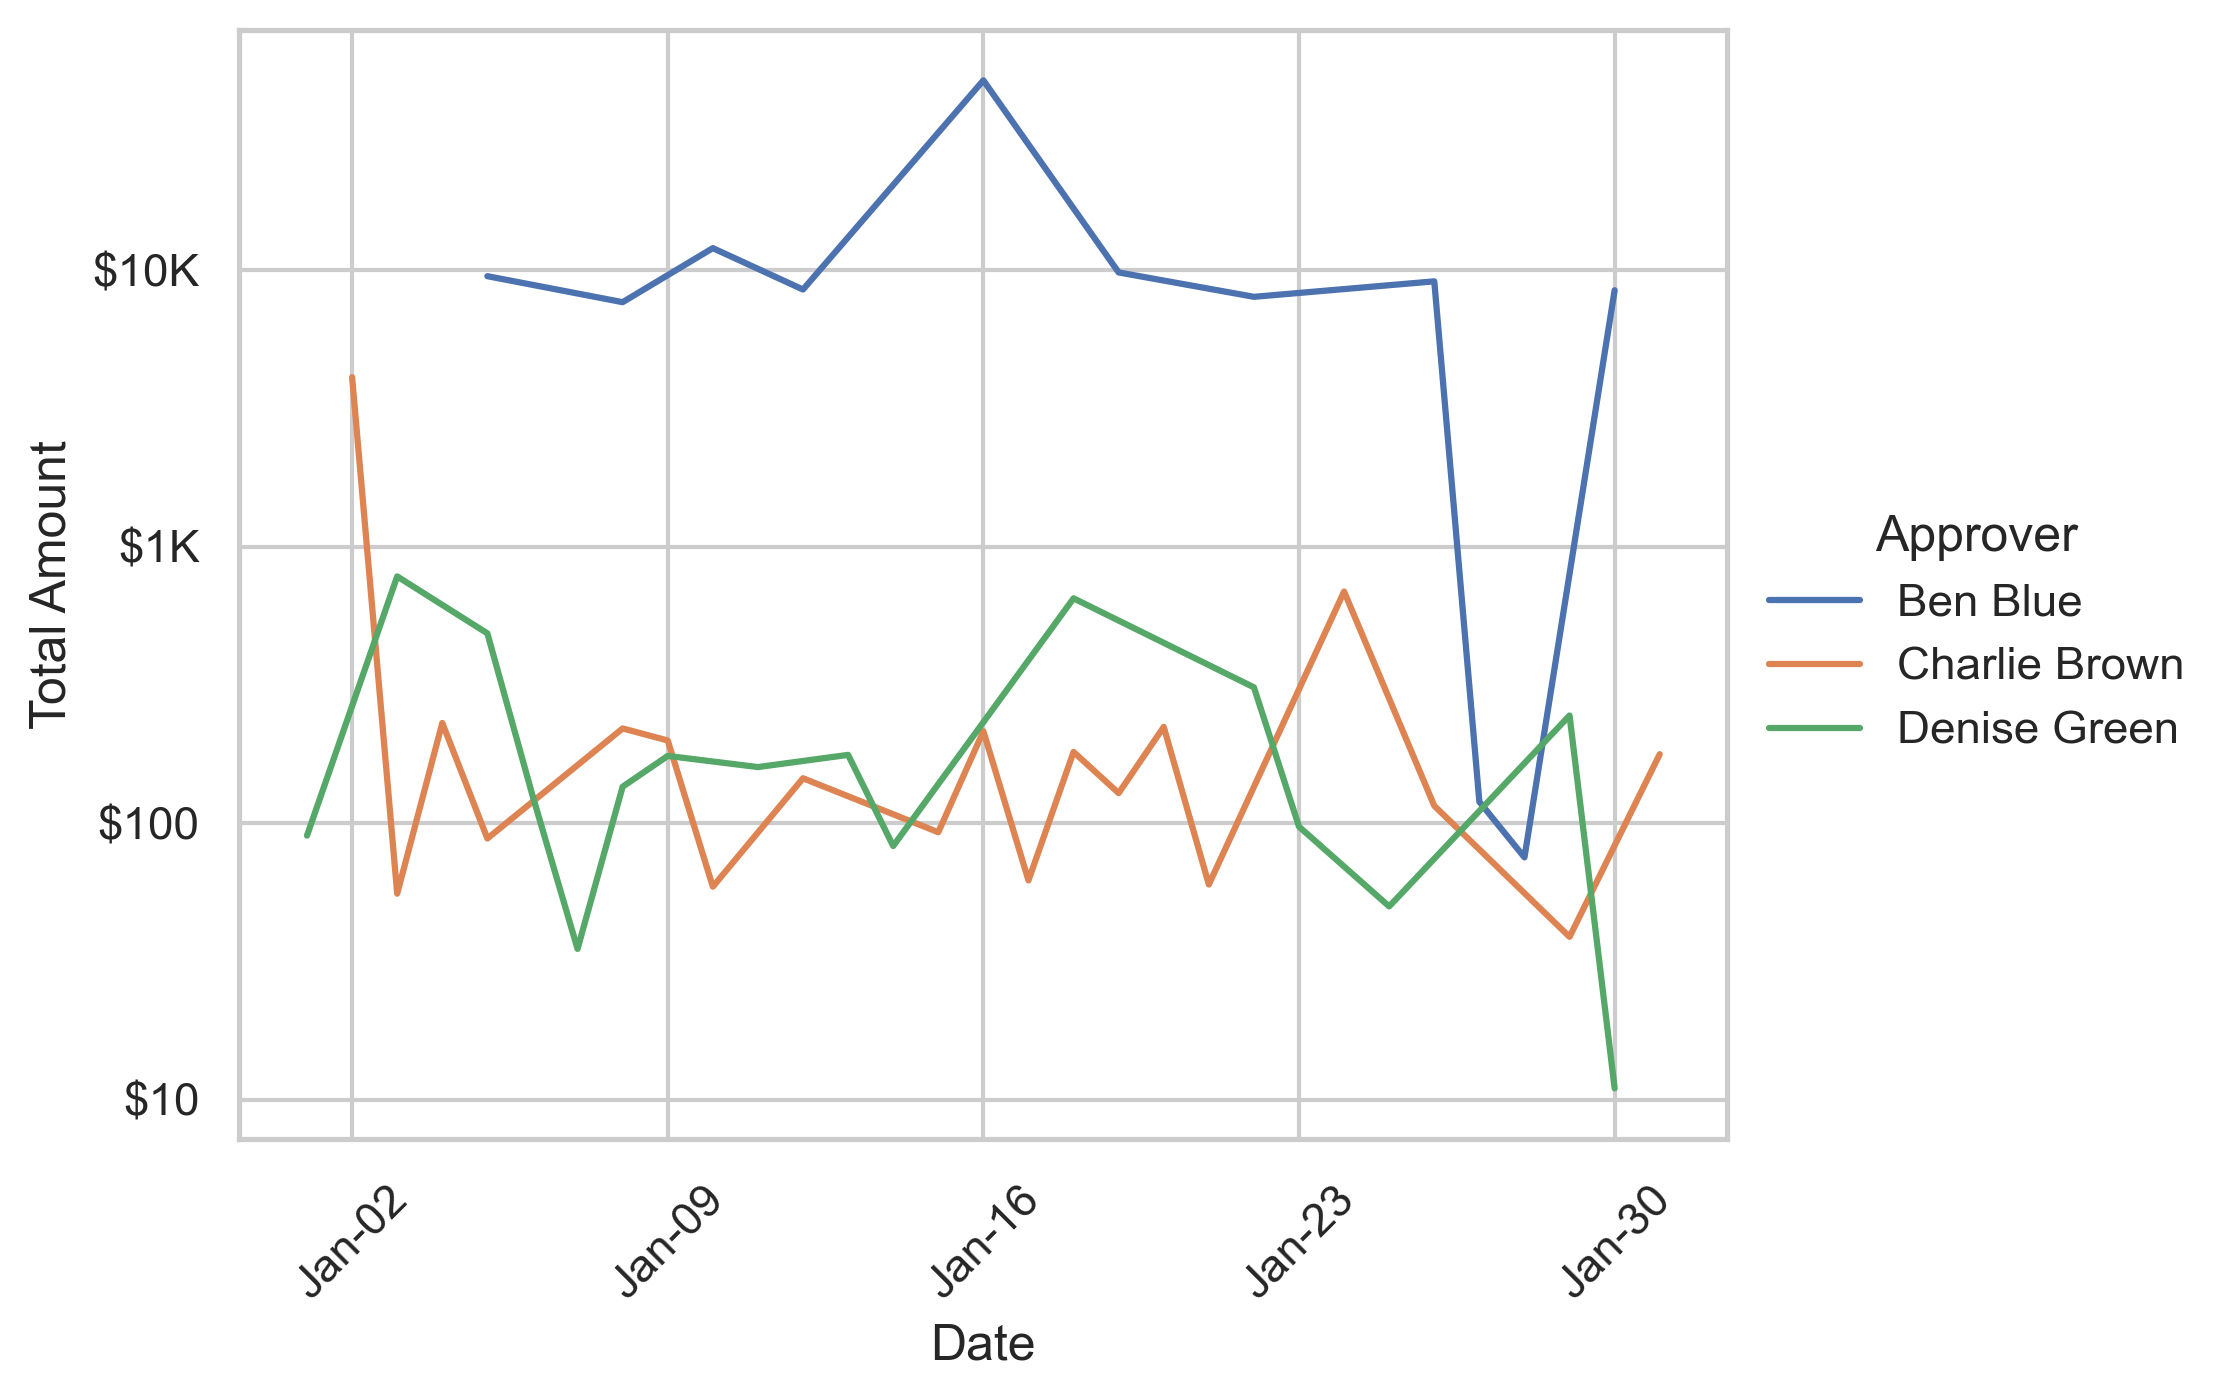
- Amounts over time by approver (line plot)
- Distribution of amounts by approver (box plot)
- Amounts by vendor (histogram)
Next Step: Day of Week
Over Time by approver
Amounts by approver
Investigate Ben Blue
| Date | Amount | Personell | Vendor | Notes | Category | Approver |
|---|---|---|---|---|---|---|
| 2024-01-05 | 9,500 | Ben Blue | Global Strategic Solutions Ltd. | Phase 1 Strategic Review Payment | Consulting | Ben Blue |
| 2024-01-08 | 7,651 | Ben Blue | Apex Universal Consulting Inc. | Consulting Services - Project Alpha | Consulting | Ben Blue |
| 2024-01-10 | 12,000 | Ben Blue | Innovate Solutions Group LLC | Synergy Project Kickoff Fee | Consulting | Ben Blue |
| 2024-01-12 | 8,500 | Ben Blue | Global Strategic Solutions Ltd. | Ongoing Strategic Support Retainer | Consulting | Ben Blue |
| 2024-01-16 | 48,500 | Ben Blue | Apex Universal Consulting Inc. | Market Research Analysis Q1 | Consulting | Ben Blue |
| 2024-01-19 | 9,800 | Ben Blue | Global Strategic Solutions Ltd. | Discreet Project Support | Consulting | Ben Blue |
| 2024-01-22 | 8,000 | Ben Blue | Apex Universal Consulting Inc. | Expedited Advisory Fee | Consulting | Ben Blue |
| 2024-01-26 | 9,100 | Ben Blue | Global Strategic Solutions Ltd. | Final Strategic Consultation Jan | Consulting | Ben Blue |
| 2024-01-27 | 150 | Emily Jones | Amtrak | Train ticket E. Jones - Regional Meeting | Travel | Ben Blue |
| 2024-01-27 | 88.90 | Emily Jones | Regional Conference Hotels | Hotel E. Jones - Regional Meeting | Travel | Ben Blue |
| 2024-01-28 | 75.20 | Emily Jones | Fine Dining Group LLC | Dinner E. Jones - Regional Meeting | Meals & Ent. | Ben Blue |
| 2024-01-30 | 8,450 | Ben Blue | Apex Universal Consulting Inc. | Final Jan Retainer - Project Alpha | Consulting | Ben Blue |
Project 1 – Due Sunday
- Groups up to 5 optional
- Deliverable pdf slide-deck