Week 5
Combining Data and Relationships
- Instructors
- Maclean Gaulin
Industry Outliers
| Ticker | Year | Industry | NI | EPS |
|---|---|---|---|---|
| BOOT | 2024 | Consumer Discr. | 180.9 | 5.93 |
| BRSL | 2024 | Consumer Discr. | 348.0 | 1.73 |
| BRIA | 2024 | Consumer Discr. | 2.8 | 0.11 |
| ETD | 2024 | Consumer Discr. | 63.8 | 2.50 |
| EDAP | 2024 | Health Care | (19.6) | (0.53) |
| CNTB | 2024 | Health Care | (15.6) | (0.28) |
| SPRO | 2024 | Health Care | (68.5) | (1.27) |
| PCLOF | 2024 | Health Care | (11.3) | (0.07) |
- (BRILLIA INC)
- (PHARMACIELO LTD)
- How to compare firms to the industry “norm”?
Why combine data?
- Myriad data sources
- External data (marketing data, economic data, etc.)
- Various internal systems (invoices, production, etc.)
- Aggregation
- Aggregation can require combining data with itself
- Analysis, cleaning, and verification
- Comparing observations, interpolating, etc.
Relational Database
- Database
- Table 1:
GL_Detail
- Table 2:
Chart_of_Accounts
| journal_id | line_id | account_id | amount |
|---|---|---|---|
| 1 | 1 | 9003 | 500 |
| 1 | 2 | 2002 | 500 |
| 1 | 3 | 9500 | 350 |
| 1 | 4 | 4002 | 350 |
| account_id | account_name | segment |
|---|---|---|
| 1000 | Cash | SW |
| 2002 | Receivables | SW |
| 4002 | Inventory | SW |
| 8002 | Retained Earn. | SW |
| 9003 | Revenue | SW |
| 9500 | COGS | SW |
Relational database
- Relations often through “keys” that link tables
- Primary key is used to define an observation (row) in a table
- Foreign key is included in a table to link to the primary key of another table (link the rows)
- E.g.
account_idis a foreign key inGL_Detail, and the primary key inChart_of_Accounts
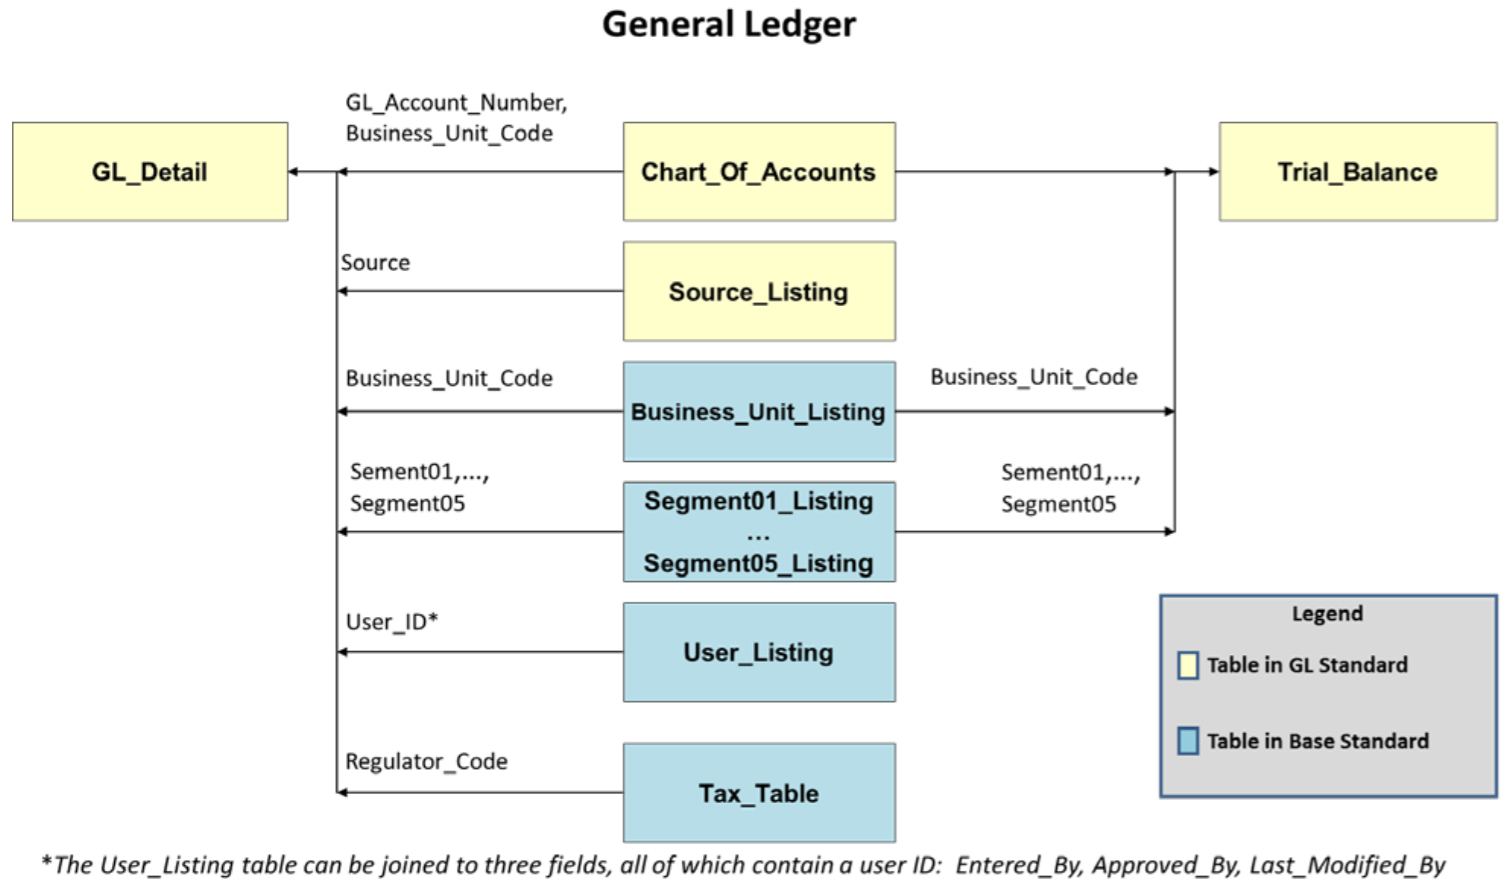
Base & General Ledger
Relationship Types
- Relationships can be singular or multiple
- 1:1 – one row in table 1 matches one row in table 2
- 1:m – one row in T1 matches multiple rows in T2
- E.g. 1 employee matches with multiple salary payments
- m:1 – multiple rows in T1 match with one row in T2
- E.g. multiple employees will match with 1 manager
- m:m – multiple rows in T1 match multiple rows in T2
- E.g. employees could be in multiple committees, and the committees have multiple employees in them
Many to Many relationships
| employee_id | name |
|---|---|
| 0 | Alice |
| 1 | Bob |
| 2 | Candice |
| employee_id | committee_id |
|---|---|
| 0 | 0 |
| 0 | 1 |
| 1 | 0 |
| 1 | 2 |
| 2 | 1 |
| 2 | 2 |
| committee_id | name |
|---|---|
| 0 | Xcelerate Growth Strategy |
| 1 | Year-End Financial Review |
| 2 | Zero-Based Budgeting |
| Employee | Committee |
|---|---|
| Alice | Xcelerate Growth Strategy |
| Alice | Year-End Financial Review |
| Bob | Xcelerate Growth Strategy |
| Bob | Zero-Based Budgeting |
| Candice | Year-End Financial Review |
| Candice | Zero-Based Budgeting |
AICPA Standards
- Base standard addressing users, business units, segments, and tax
- General Ledger (chart of accounts, GL, trial balance)
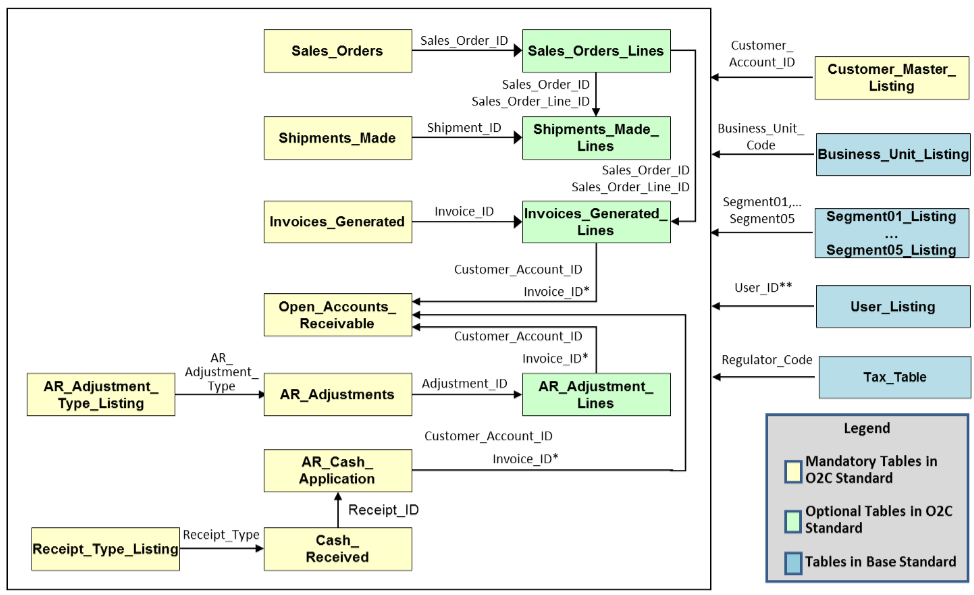
- Order to Cash subledger
- Procure to Pay subledger
- Inventory subledger
- Fixed Asset subledger
Order to Cash subledger
SQL: Structured Query Language
- SQL is the language used to interact with RDBs
- SQL playground: sqlbolt.com
- Do you need to know SQL?
- You should understand conceptually the moving parts
- You should understand what it can and can’t do
- Which you can ask LLMs
- Learn it if you need it, are interested, or taking the ISC section of the CPA
Types of joins
- Inner: just keep rows that match
- Outer: keep all rows
- Left/right: keep all rows from one table
- Cross: every row in one table for every row in the other
- Self: joining a table with itself (could be inner, outer, or left/right)
- Union: concatenating datasets, e.g. adding rows together, not columns together
Inner join
- Just keep rows that match (join keys are in both tables)
- Most common join (JOIN keyword in SQL is inner)
Outer join
- Keeps all rows from both tables
- Rows that do not match other table are filled with missing (NULL)
- Can create large datasets
| NULLs | |
|---|---|
| NULLs | |
Left/Right join
- Keeps all rows in one table
- Used to add columns from another table without altering original rows
- Left and right join are the same with swapped table orders
- A
left joinB = Bright joinA
| NULLs |
Cross Join
- Creates all combinations of rows
- Every row in T1 will be merged with every row in T2
- Used to expand datasets
- Example: going from yearly to monthly
- Used to get all combinations of values
- Example: match every buyer to every seller to find best trades
Range Merges
- Join tables based on data from one being within a range based on columns from the other
- E.g. Get last year of transactions (with fiscal year end)
- SQL:
b.dateBETWEENa.last_fyeANDa.fye - Used for time-series, binning, finding overlaps, etc.
- Considering overlaps is key to avoid duplication
Range Merges
- Most accounting/financial data is time-based, range merges very common
- Returns Dataset
| date | ticker | returns |
|---|---|---|
| 1/3/2023 | AAPL | -3.7% |
| 1/4/2023 | AAPL | 1.0% |
| 1/5/2023 | AAPL | -1.1% |
| 1/6/2023 | AAPL | 3.7% |
| 1/9/2023 | AAPL | 0.4% |
| … | … | … |
| 12/29/2023 | AAPL | -0.5% |
- Financials Dataset
| fye | ticker | AT |
|---|---|---|
| 12/31/2023 | AAPL | 352,583 |
| 12/31/2024 | AAPL | 364,980 |
Multiple Merges
- Connecting merges are a common use of multiple merges
- Often built one merge at a time
- Transaction Dataset
- Customer Dataset
- Financials Dataset
| customer_id | Name |
|---|---|
| 0 | Alice |
| 1 | Bob |
| … | … |
| date | customer_id | amount |
|---|---|---|
| 1/3/2023 | 0 | 156.34 |
| 1/4/2023 | 1 | 2,000.41 |
| 1/5/2023 | 1 | 75.05 |
| … | … | … |
| fye | ticker | AT |
|---|---|---|
| 12/31/2023 | AAPL | 352,583 |
| 12/31/2024 | AAPL | 364,980 |
Merging without keys
- Keys work for perfect matches (equality)
- What about when there is no key?
- Data from external source
- Data with noise or errors
- Data with non-perfect overlap (e.g. spatial data)
- Statistical / fuzzy matching used in these cases
Aggregations
- Calculations across multiple rows
- Counting, summing, averaging, regressions, etc.
- Aggregations collapse multiple rows into one
- Often combined with merges
- E.g. total expenses by vendor within date range
- Often done in “subquery” and merged
Aggregations
- Adding yearly returns to financial dataset
- Returns Dataset
- Financials Dataset
- sub-query
| fye | ticker | AT |
|---|---|---|
| 12/31/2023 | AAPL | 352,583 |
| 12/31/2024 | AAPL | 364,980 |
| date | ticker | returns |
|---|---|---|
| 1/3/2023 | AAPL | -3.7% |
| … | … | … |
| 12/29/2023 | AAPL | -0.5% |
| 1/2/2024 | AAPL | -3.5% |
| … | … | … |
| 12/29/2024 | AAPL | -0.7% |
| 1/3/2023 | GOOGL | -2.5% |
| … | … | … |
| fyear | ticker | ave_ret | cuml_ret |
|---|---|---|---|
| 2023 | AAPL | 0.1% | 49.0% |
| 2024 | AAPL | 0.1% | 30.7% |
| 2023 | GOOG | 0.2% | 58.8% |
Levels of Aggregation
| Year | Month | Day | State | City | Amount |
|---|---|---|---|---|---|
| 2024 | 1 | 1 | UT | SLC | 10 |
| 2024 | 1 | 2 | UT | SLC | 11 |
| 2024 | 2 | 1 | UT | SLC | 12 |
| 2024 | 2 | 2 | UT | SLC | 13 |
| 2023 | 1 | 1 | UT | SLC | 14 |
| 2023 | 1 | 2 | UT | SLC | 15 |
| 2023 | 2 | 1 | UT | SLC | 16 |
| 2023 | 2 | 2 | UT | SLC | 17 |
| 2024 | 1 | 1 | UT | Provo | 20 |
| 2024 | 1 | 2 | UT | Provo | 21 |
| 2024 | 2 | 1 | UT | Provo | 22 |
| 2024 | 2 | 2 | UT | Provo | 23 |
| 2023 | 1 | 1 | UT | Provo | 24 |
| 2023 | 1 | 2 | UT | Provo | 25 |
| 2023 | 2 | 1 | UT | Provo | 26 |
| 2023 | 2 | 2 | UT | Provo | 27 |
| 2024 | 1 | 1 | CO | Denver | 30 |
| 2024 | 1 | 2 | CO | Denver | 31 |
| 2024 | 2 | 1 | CO | Denver | 32 |
| 2024 | 2 | 2 | CO | Denver | 33 |
| 2023 | 1 | 1 | CO | Denver | 34 |
| 2023 | 1 | 2 | CO | Denver | 35 |
| 2023 | 2 | 1 | CO | Denver | 36 |
| 2023 | 2 | 2 | CO | Denver | 37 |
| 2024 | 1 | 1 | CO | Boulder | 40 |
| 2024 | 1 | 2 | CO | Boulder | 41 |
| 2024 | 2 | 1 | CO | Boulder | 42 |
| 2024 | 2 | 2 | CO | Boulder | 43 |
| 2023 | 1 | 1 | CO | Boulder | 44 |
| 2023 | 1 | 2 | CO | Boulder | 45 |
| 2023 | 2 | 1 | CO | Boulder | 46 |
| 2023 | 2 | 2 | CO | Boulder | 47 |
- The same data can be aggregated many different ways
- How we aggregate changes what information we get
| Year | Month | Day | State | City | Amount |
|---|---|---|---|---|---|
| 2024 | 1 | 1 | UT | SLC | 10 |
| 2024 | 1 | 2 | UT | SLC | 11 |
| 2024 | 2 | 1 | UT | SLC | 12 |
| 2024 | 2 | 2 | UT | SLC | 13 |
| 2023 | 1 | 1 | UT | SLC | 14 |
| 2023 | 1 | 2 | UT | SLC | 15 |
| 2023 | 2 | 1 | UT | SLC | 16 |
| 2023 | 2 | 2 | UT | SLC | 17 |
| 2024 | 1 | 1 | UT | Provo | 20 |
| 2024 | 1 | 2 | UT | Provo | 21 |
| 2024 | 2 | 1 | UT | Provo | 22 |
| 2024 | 2 | 2 | UT | Provo | 23 |
| 2023 | 1 | 1 | UT | Provo | 24 |
| 2023 | 1 | 2 | UT | Provo | 25 |
| 2023 | 2 | 1 | UT | Provo | 26 |
| 2023 | 2 | 2 | UT | Provo | 27 |
| 2024 | 1 | 1 | CO | Denver | 30 |
| 2024 | 1 | 2 | CO | Denver | 31 |
| 2024 | 2 | 1 | CO | Denver | 32 |
| 2024 | 2 | 2 | CO | Denver | 33 |
| 2023 | 1 | 1 | CO | Denver | 34 |
| 2023 | 1 | 2 | CO | Denver | 35 |
| 2023 | 2 | 1 | CO | Denver | 36 |
| 2023 | 2 | 2 | CO | Denver | 37 |
| 2024 | 1 | 1 | CO | Boulder | 40 |
| 2024 | 1 | 2 | CO | Boulder | 41 |
| 2024 | 2 | 1 | CO | Boulder | 42 |
| 2024 | 2 | 2 | CO | Boulder | 43 |
| 2023 | 1 | 1 | CO | Boulder | 44 |
| 2023 | 1 | 2 | CO | Boulder | 45 |
| 2023 | 2 | 1 | CO | Boulder | 46 |
| 2023 | 2 | 2 | CO | Boulder | 47 |
- Group by Year
- Average across location, within year
| Years | Average Amount |
|---|---|
| 2023 | 30.5 |
| 2024 | 26.5 |
| Year | Month | Day | State | City | Amount |
|---|---|---|---|---|---|
| 2024 | 1 | 1 | UT | SLC | 10 |
| 2024 | 1 | 2 | UT | SLC | 11 |
| 2024 | 2 | 1 | UT | SLC | 12 |
| 2024 | 2 | 2 | UT | SLC | 13 |
| 2023 | 1 | 1 | UT | SLC | 14 |
| 2023 | 1 | 2 | UT | SLC | 15 |
| 2023 | 2 | 1 | UT | SLC | 16 |
| 2023 | 2 | 2 | UT | SLC | 17 |
| 2024 | 1 | 1 | UT | Provo | 20 |
| 2024 | 1 | 2 | UT | Provo | 21 |
| 2024 | 2 | 1 | UT | Provo | 22 |
| 2024 | 2 | 2 | UT | Provo | 23 |
| 2023 | 1 | 1 | UT | Provo | 24 |
| 2023 | 1 | 2 | UT | Provo | 25 |
| 2023 | 2 | 1 | UT | Provo | 26 |
| 2023 | 2 | 2 | UT | Provo | 27 |
| 2024 | 1 | 1 | CO | Denver | 30 |
| 2024 | 1 | 2 | CO | Denver | 31 |
| 2024 | 2 | 1 | CO | Denver | 32 |
| 2024 | 2 | 2 | CO | Denver | 33 |
| 2023 | 1 | 1 | CO | Denver | 34 |
| 2023 | 1 | 2 | CO | Denver | 35 |
| 2023 | 2 | 1 | CO | Denver | 36 |
| 2023 | 2 | 2 | CO | Denver | 37 |
| 2024 | 1 | 1 | CO | Boulder | 40 |
| 2024 | 1 | 2 | CO | Boulder | 41 |
| 2024 | 2 | 1 | CO | Boulder | 42 |
| 2024 | 2 | 2 | CO | Boulder | 43 |
| 2023 | 1 | 1 | CO | Boulder | 44 |
| 2023 | 1 | 2 | CO | Boulder | 45 |
| 2023 | 2 | 1 | CO | Boulder | 46 |
| 2023 | 2 | 2 | CO | Boulder | 47 |
- Group by Year and Month
- Average across location, within year and month
| Year/Month | Average Amount |
|---|---|
| 2023 – 01 | 29.5 |
| 2023 – 02 | 31.5 |
| 2024 – 01 | 25.5 |
| 2024 – 02 | 27.5 |
| Year | Month | Day | State | City | Amount |
|---|---|---|---|---|---|
| 2024 | 1 | 1 | UT | SLC | 10 |
| 2024 | 1 | 2 | UT | SLC | 11 |
| 2024 | 2 | 1 | UT | SLC | 12 |
| 2024 | 2 | 2 | UT | SLC | 13 |
| 2023 | 1 | 1 | UT | SLC | 14 |
| 2023 | 1 | 2 | UT | SLC | 15 |
| 2023 | 2 | 1 | UT | SLC | 16 |
| 2023 | 2 | 2 | UT | SLC | 17 |
| 2024 | 1 | 1 | UT | Provo | 20 |
| 2024 | 1 | 2 | UT | Provo | 21 |
| 2024 | 2 | 1 | UT | Provo | 22 |
| 2024 | 2 | 2 | UT | Provo | 23 |
| 2023 | 1 | 1 | UT | Provo | 24 |
| 2023 | 1 | 2 | UT | Provo | 25 |
| 2023 | 2 | 1 | UT | Provo | 26 |
| 2023 | 2 | 2 | UT | Provo | 27 |
| 2024 | 1 | 1 | CO | Denver | 30 |
| 2024 | 1 | 2 | CO | Denver | 31 |
| 2024 | 2 | 1 | CO | Denver | 32 |
| 2024 | 2 | 2 | CO | Denver | 33 |
| 2023 | 1 | 1 | CO | Denver | 34 |
| 2023 | 1 | 2 | CO | Denver | 35 |
| 2023 | 2 | 1 | CO | Denver | 36 |
| 2023 | 2 | 2 | CO | Denver | 37 |
| 2024 | 1 | 1 | CO | Boulder | 40 |
| 2024 | 1 | 2 | CO | Boulder | 41 |
| 2024 | 2 | 1 | CO | Boulder | 42 |
| 2024 | 2 | 2 | CO | Boulder | 43 |
| 2023 | 1 | 1 | CO | Boulder | 44 |
| 2023 | 1 | 2 | CO | Boulder | 45 |
| 2023 | 2 | 1 | CO | Boulder | 46 |
| 2023 | 2 | 2 | CO | Boulder | 47 |
- Group by Year and State
- Average across City and month/day, within year and state
| Year/State | Average Amount |
|---|---|
| 2023 UT | 20.5 |
| 2023 CO | 40.5 |
| 2024 UT | 16.5 |
| 2024 CO | 36.5 |
| Year | Month | Day | State | City | Amount |
|---|---|---|---|---|---|
| 2024 | 1 | 1 | UT | SLC | 10 |
| 2024 | 1 | 2 | UT | SLC | 11 |
| 2024 | 2 | 1 | UT | SLC | 12 |
| 2024 | 2 | 2 | UT | SLC | 13 |
| 2023 | 1 | 1 | UT | SLC | 14 |
| 2023 | 1 | 2 | UT | SLC | 15 |
| 2023 | 2 | 1 | UT | SLC | 16 |
| 2023 | 2 | 2 | UT | SLC | 17 |
| 2024 | 1 | 1 | UT | Provo | 20 |
| 2024 | 1 | 2 | UT | Provo | 21 |
| 2024 | 2 | 1 | UT | Provo | 22 |
| 2024 | 2 | 2 | UT | Provo | 23 |
| 2023 | 1 | 1 | UT | Provo | 24 |
| 2023 | 1 | 2 | UT | Provo | 25 |
| 2023 | 2 | 1 | UT | Provo | 26 |
| 2023 | 2 | 2 | UT | Provo | 27 |
| 2024 | 1 | 1 | CO | Denver | 30 |
| 2024 | 1 | 2 | CO | Denver | 31 |
| 2024 | 2 | 1 | CO | Denver | 32 |
| 2024 | 2 | 2 | CO | Denver | 33 |
| 2023 | 1 | 1 | CO | Denver | 34 |
| 2023 | 1 | 2 | CO | Denver | 35 |
| 2023 | 2 | 1 | CO | Denver | 36 |
| 2023 | 2 | 2 | CO | Denver | 37 |
| 2024 | 1 | 1 | CO | Boulder | 40 |
| 2024 | 1 | 2 | CO | Boulder | 41 |
| 2024 | 2 | 1 | CO | Boulder | 42 |
| 2024 | 2 | 2 | CO | Boulder | 43 |
| 2023 | 1 | 1 | CO | Boulder | 44 |
| 2023 | 1 | 2 | CO | Boulder | 45 |
| 2023 | 2 | 1 | CO | Boulder | 46 |
| 2023 | 2 | 2 | CO | Boulder | 47 |
- Group by City
- Average across City, within year/month/day
| Year/State | Average Amount |
|---|---|
| SLC | 13.5 |
| Provo | 23.5 |
| Denver | 33.5 |
| Boulder | 43.5 |
Self Joins – Time series
- Lead/Lag variables can also be merges
- JOIN ON ticker
- AND fyear = fyear + 1
| fyear | ticker | ave_ret |
|---|---|---|
| 2023 | AAPL | 0.2% |
| 2024 | AAPL | 0.1% |
| 2023 | GOOG | 0.2% |
| fyear | ticker | ave_ret | ave_ret_last_year |
|---|---|---|---|
| 2023 | AAPL | 0.2% | – |
| 2024 | AAPL | 0.1% | 0.2% |
| 2023 | GOOG | 0.2% | – |
| fyear | fyear+1 | ticker | ave_ret |
|---|---|---|---|
| 2023 | 2024 | AAPL | 0.2% |
| 2024 | 2025 | AAPL | 0.1% |
| 2023 | 2024 | GOOG | 0.2% |