Week 13
Accounting Analytics
- Instructors
- Maclean Gaulin
Gamut of analytics in accounting
- Acquisition: collecting and measuring data
- Storage: could just be excel, but hopefully not!
- Cleaning: ensuring the quality of the data, audits
- Combination: combining multiple data sources
- Analysis: modeling the economics
- Communication: conveying accounting insights
- Data driven decisions: using analytical conclusions to inform decision-makers
Uses of Data Analytics in Business
- Data-driven decision-making
- Improved operations
- Better customer understanding
- Risk assessment & management
- Regulatory compliance
Where you fit in
- Regardless of your analytics chops, your domain expertise will always be valuable
- Don’t underestimate how impactful knowing accounting can be in DA conversations
- Don’t overestimate how much others know about accounting, you’re the expert!
- Play to your strengths
Data in 2025
- There’s a lot of it
- The 5 Vs:
- Volume
- Velocity
- Variety
- Veracity
- Value
Move to the (Private) cloud
- Only pay for storage (bits) and usage (CPU cycles)
- Server hardware maintained by third party
- Shifting CapEx to OpEx with EBITDA impact
- Provider shares resources amongst clients (or not)
- Server software maintained by third party
- Firm avoids dealing with software updates, fixes, etc.
- Customization often more difficult (platform lock-in)
- Leverage external analytics expertise
Cloud Computing caveats
- Cloud systems solve problems (tech assets, access, scale) but create others (security, complexity)
- ROI on moving to the cloud is unclear
- 66% of execs say cloud hasn’t lowered IT cost (KPMG 2022)
- Can create audit-trail concerns (right to audit)
Big Data Storage
- Data Lake: centralized hub of unstructured data
- Stores data in “raw” unprocessed format (as-is)
- Because storage is “cheap,” firms now often keep all data in its raw form, and process later when needed
- Data Warehouse: centralized hub of structured data
- Stores pre-processed data (schema-on-write)
- Governance and quality controls ensure datasets are properly formatted, normalized, ready to use
Unstructured Data
- Text, images, etc.
- Structure is missing, not-consistent, or complex
- 80-90% of collected data is unstructured
- Needs processing before it can be used
- AI is making processing this data far easier
- Examples:
- Invoices, receipts
- Regulations, FAQs, instructions, guidance
Structured Data
- Think of a spreadsheet with columns (variables) and rows (observations)
- Often quantitative, easily processed for analytics
- Can be broken into multiple, related tables (RDB)
- Examples:
- General ledger
- Chart of accounts
Wide vs Long
| ID | First Name | Last Name | # Sales |
|---|---|---|---|
| 1 | Aryll | Zelda | 394 |
| 2 | Byrne | Yunobo | 604 |
| 3 | Cia | Xani | 12 |
| ID | Variable | Value |
|---|---|---|
| 1 | First Name | Aryll |
| 1 | Last Name | Zelda |
| 1 | # Sales | 394 |
| 2 | First Name | Byrne |
| 2 | Last Name | Yunobo |
| 2 | # Sales | 604 |
| 3 | First Name | Cia |
| 3 | Last Name | Xani |
| 3 | # Sales | 12 |
- “Wide” format: add data in columns
- Each column is a different variable
- “Long” format: add data in rows
- Repeat IDs, columns for variable and value
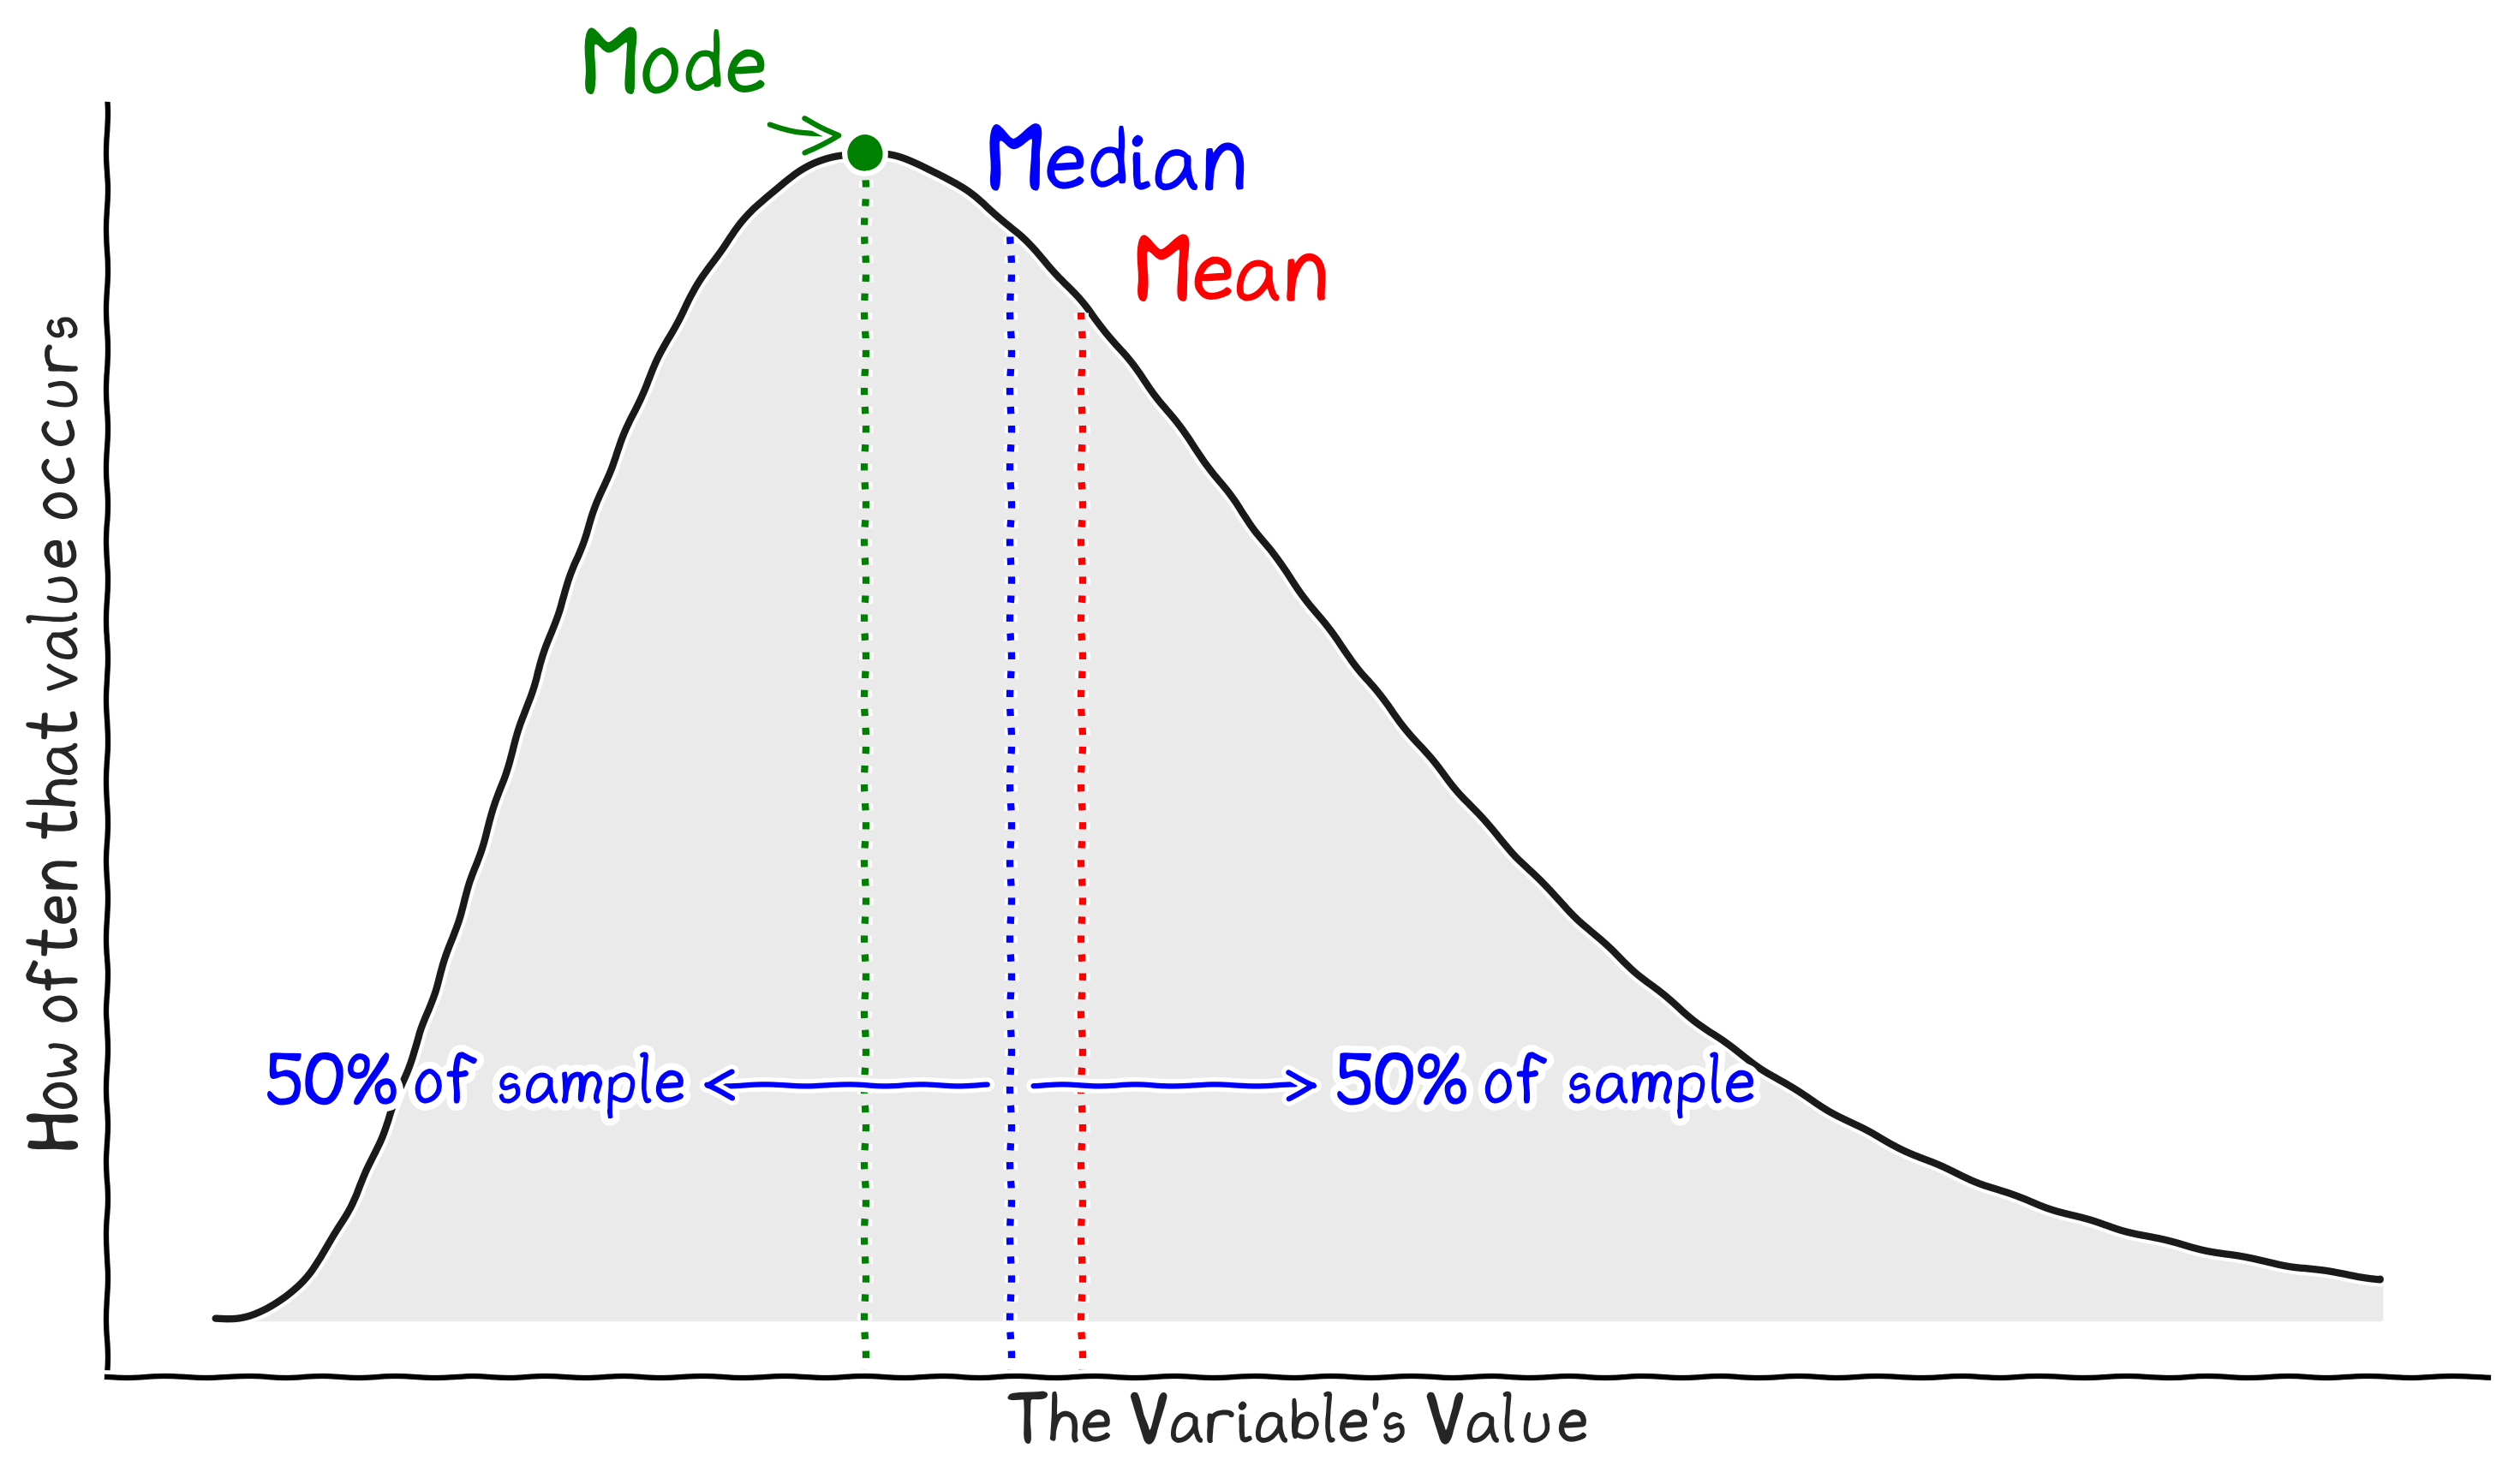
Where: Central tendency
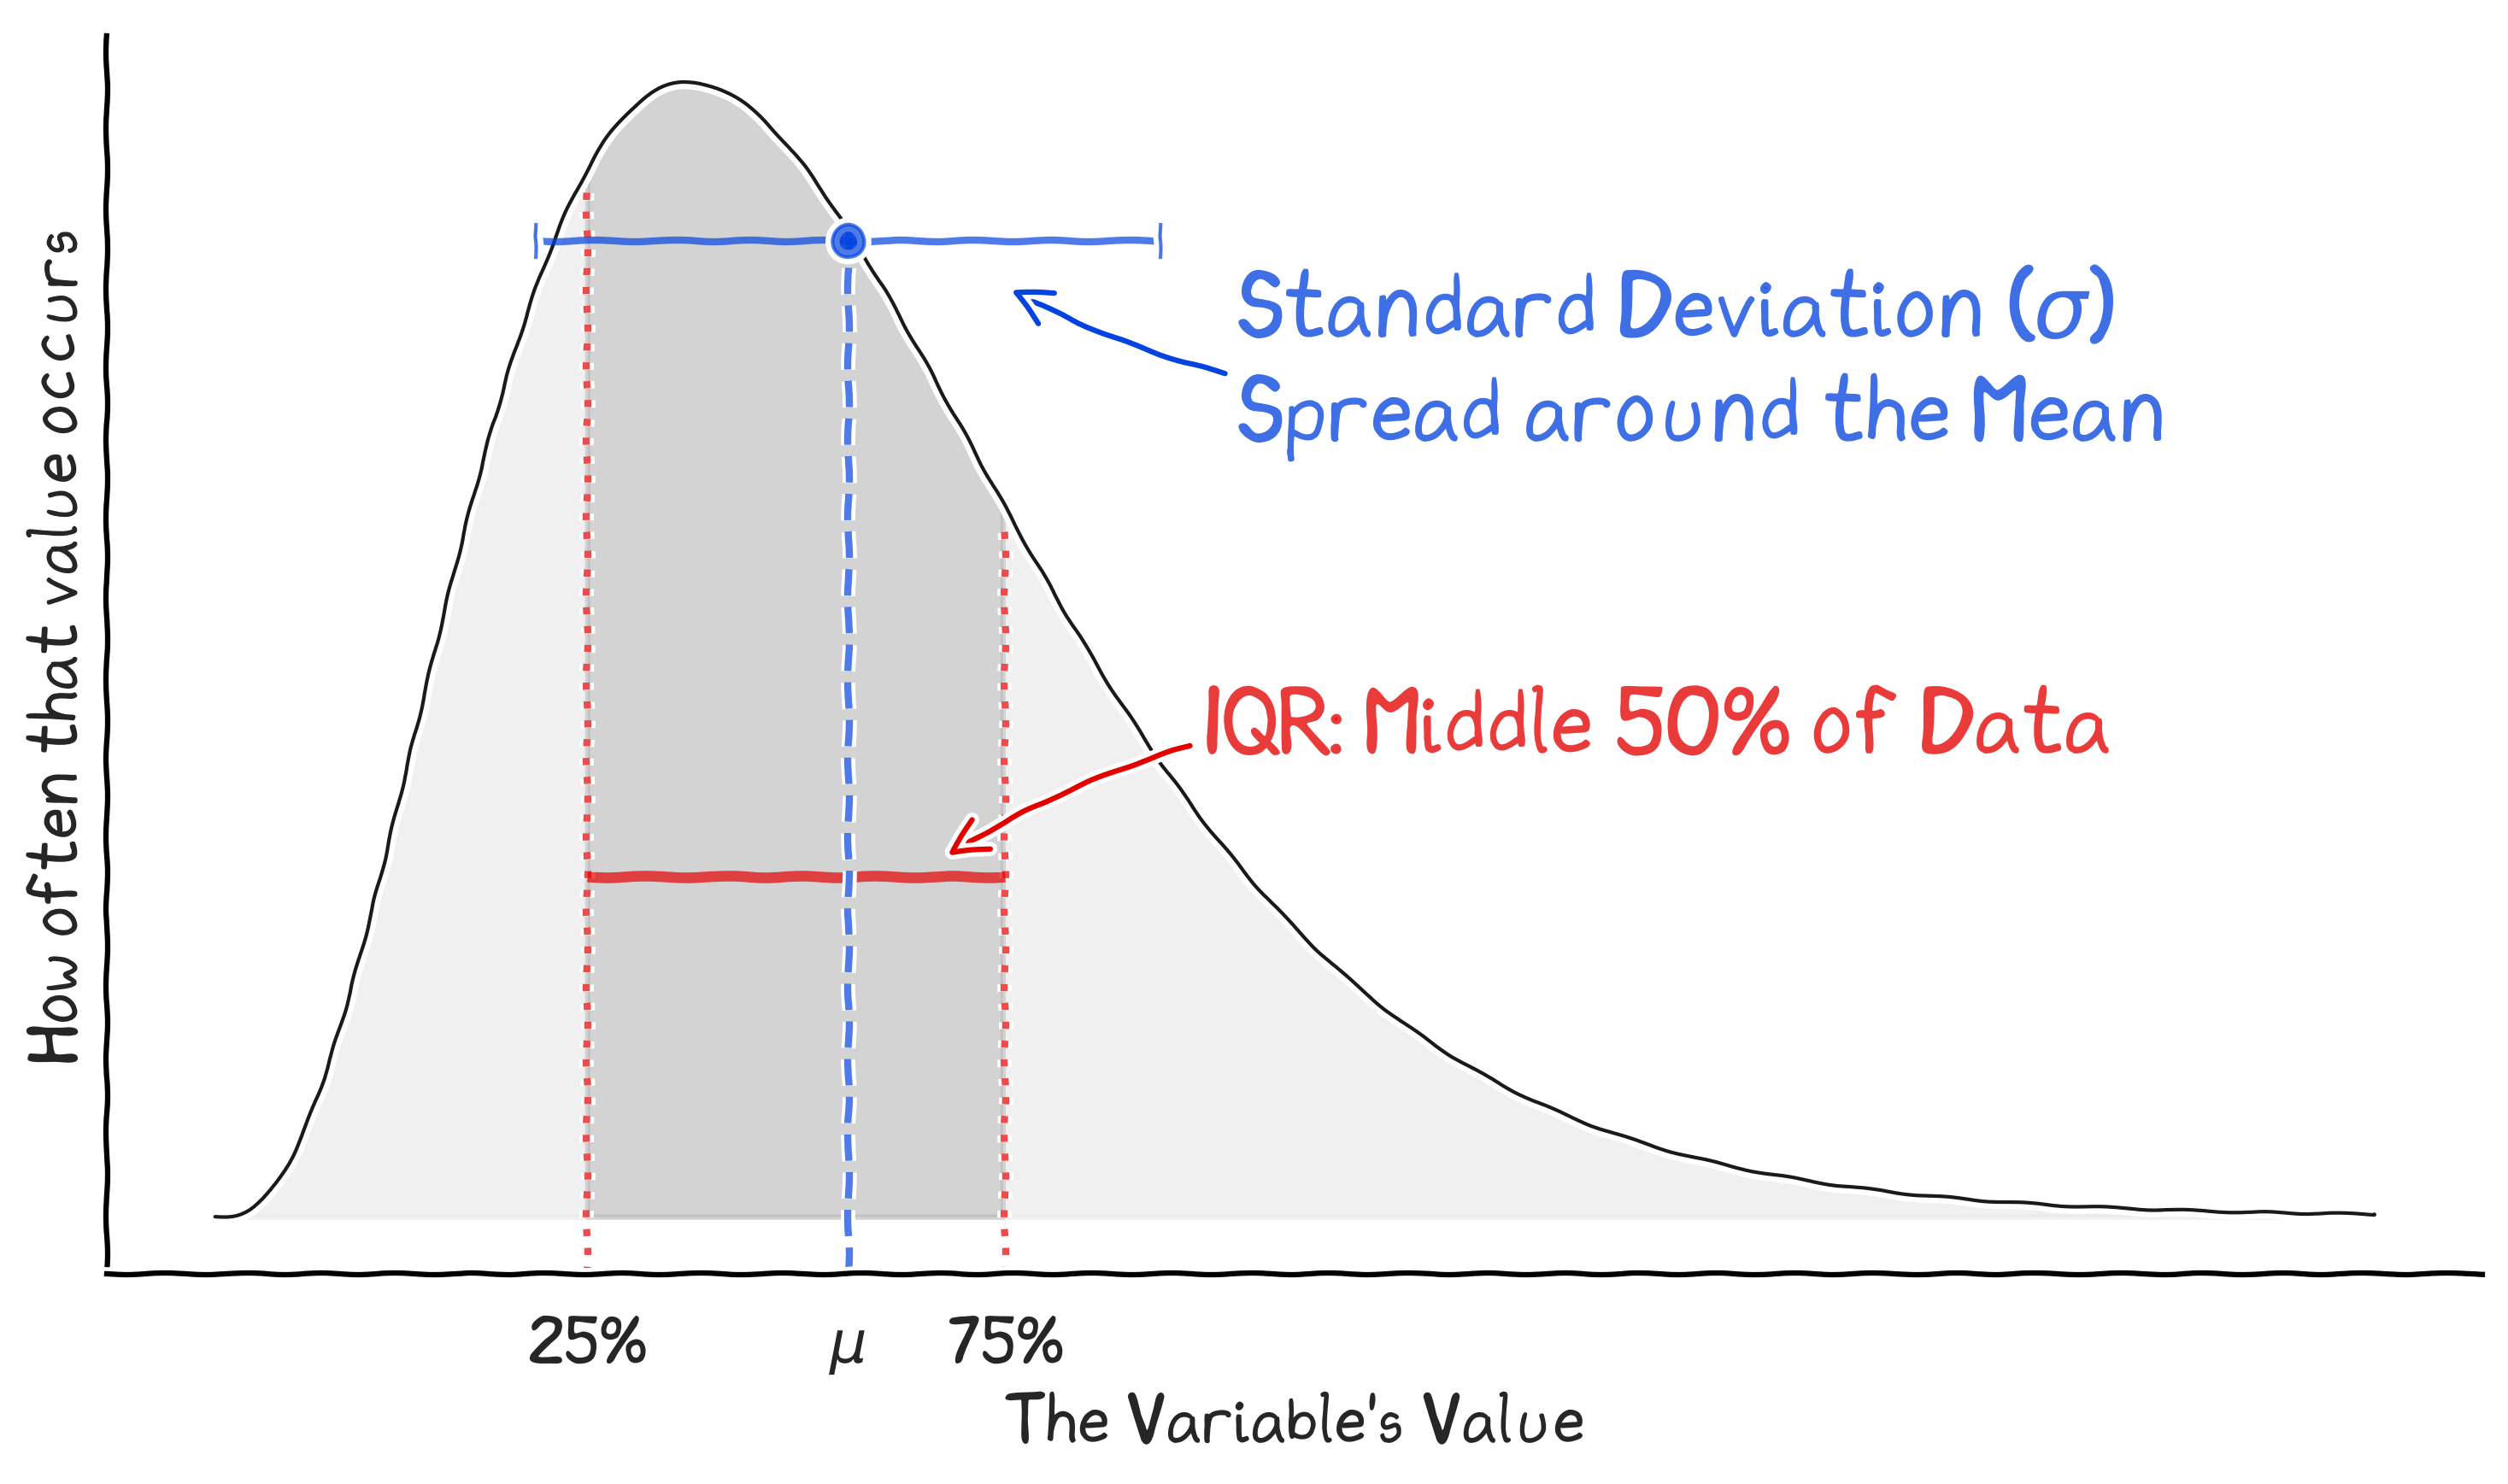
How Spread Out: variability
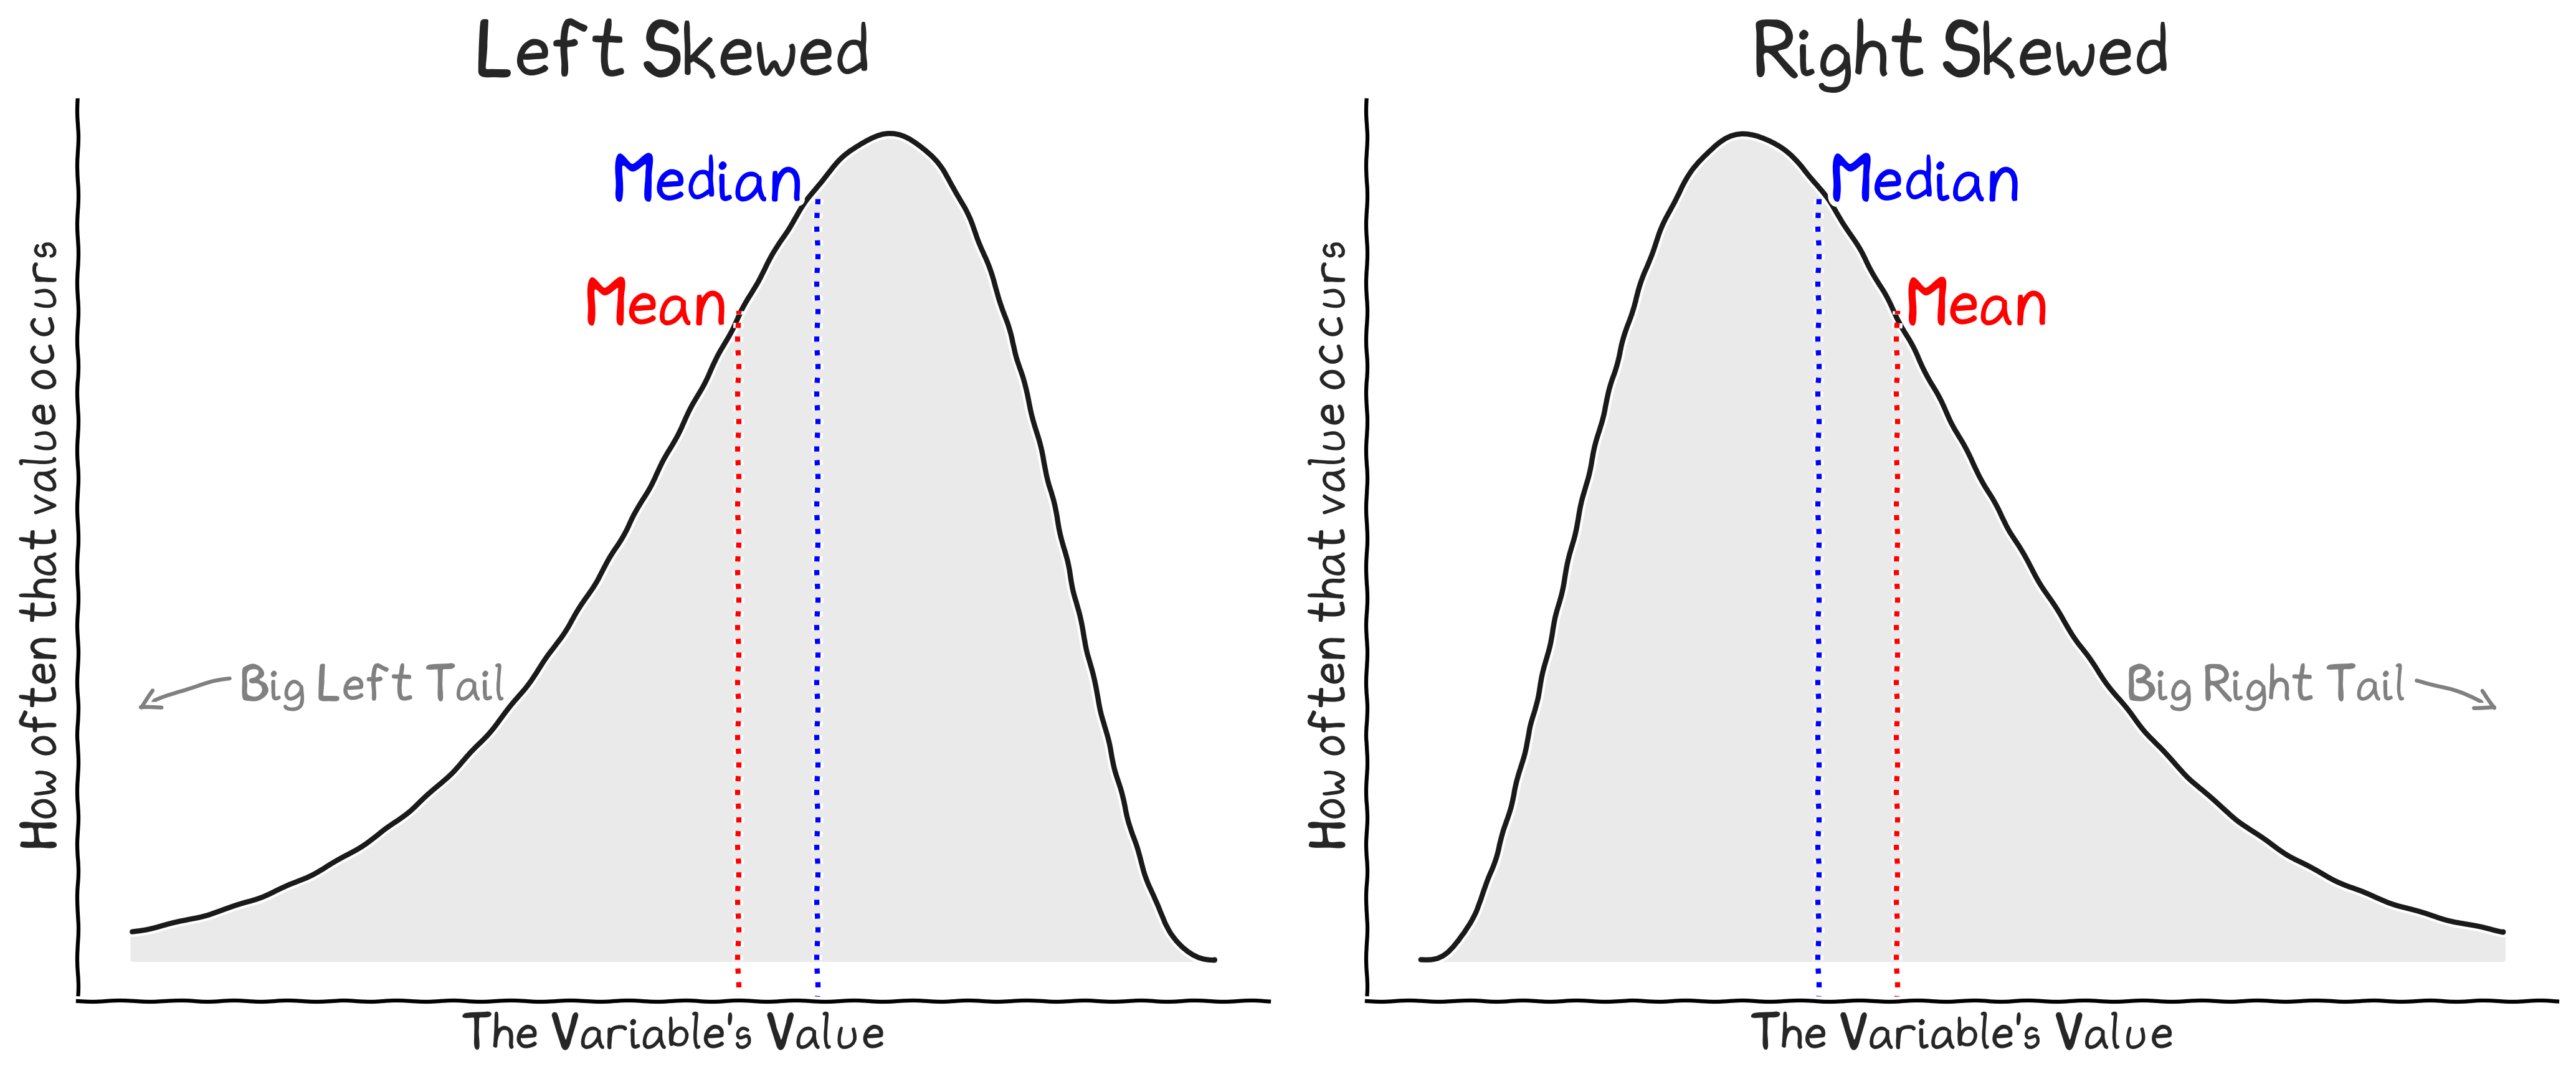
Shape: Skewness
Why Visualize?
| Dataset | |
|---|---|
| x | y |
| 55.4 | 97.2 |
| 51.5 | 96.0 |
| 46.2 | 94.5 |
| 42.8 | 91.4 |
| 40.8 | 88.3 |
| 38.7 | 84.9 |
| 35.6 | 79.9 |
| 33.1 | 77.6 |
| 29.0 | 74.5 |
| 26.2 | 71.4 |
| 55.4 | 97.2 |
| … | … |
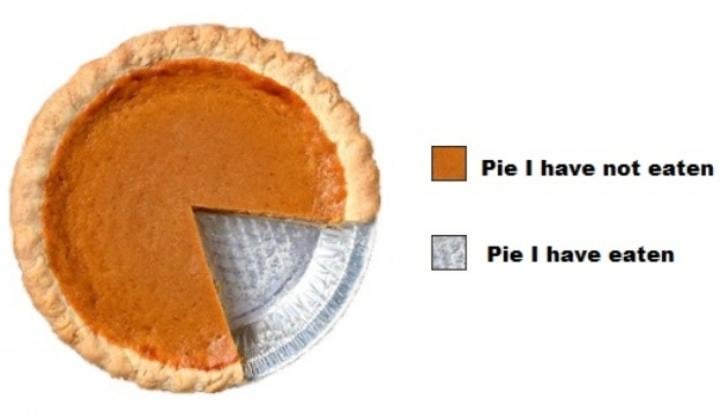
Visualization as Communication
Leverage Strengths, Mitigate Weaknesses
- Leveraging strengths of human cognition
- Visual bandwidth1: About 20 Mbps (1Gbps total)
- Pre-attentive processing2: Instinctive processing
- Graphical perception3: Process some designs better
- Mitigate constraints of human cognition
- Avoid overloading limited “working memory”4
- Leverage external recognition
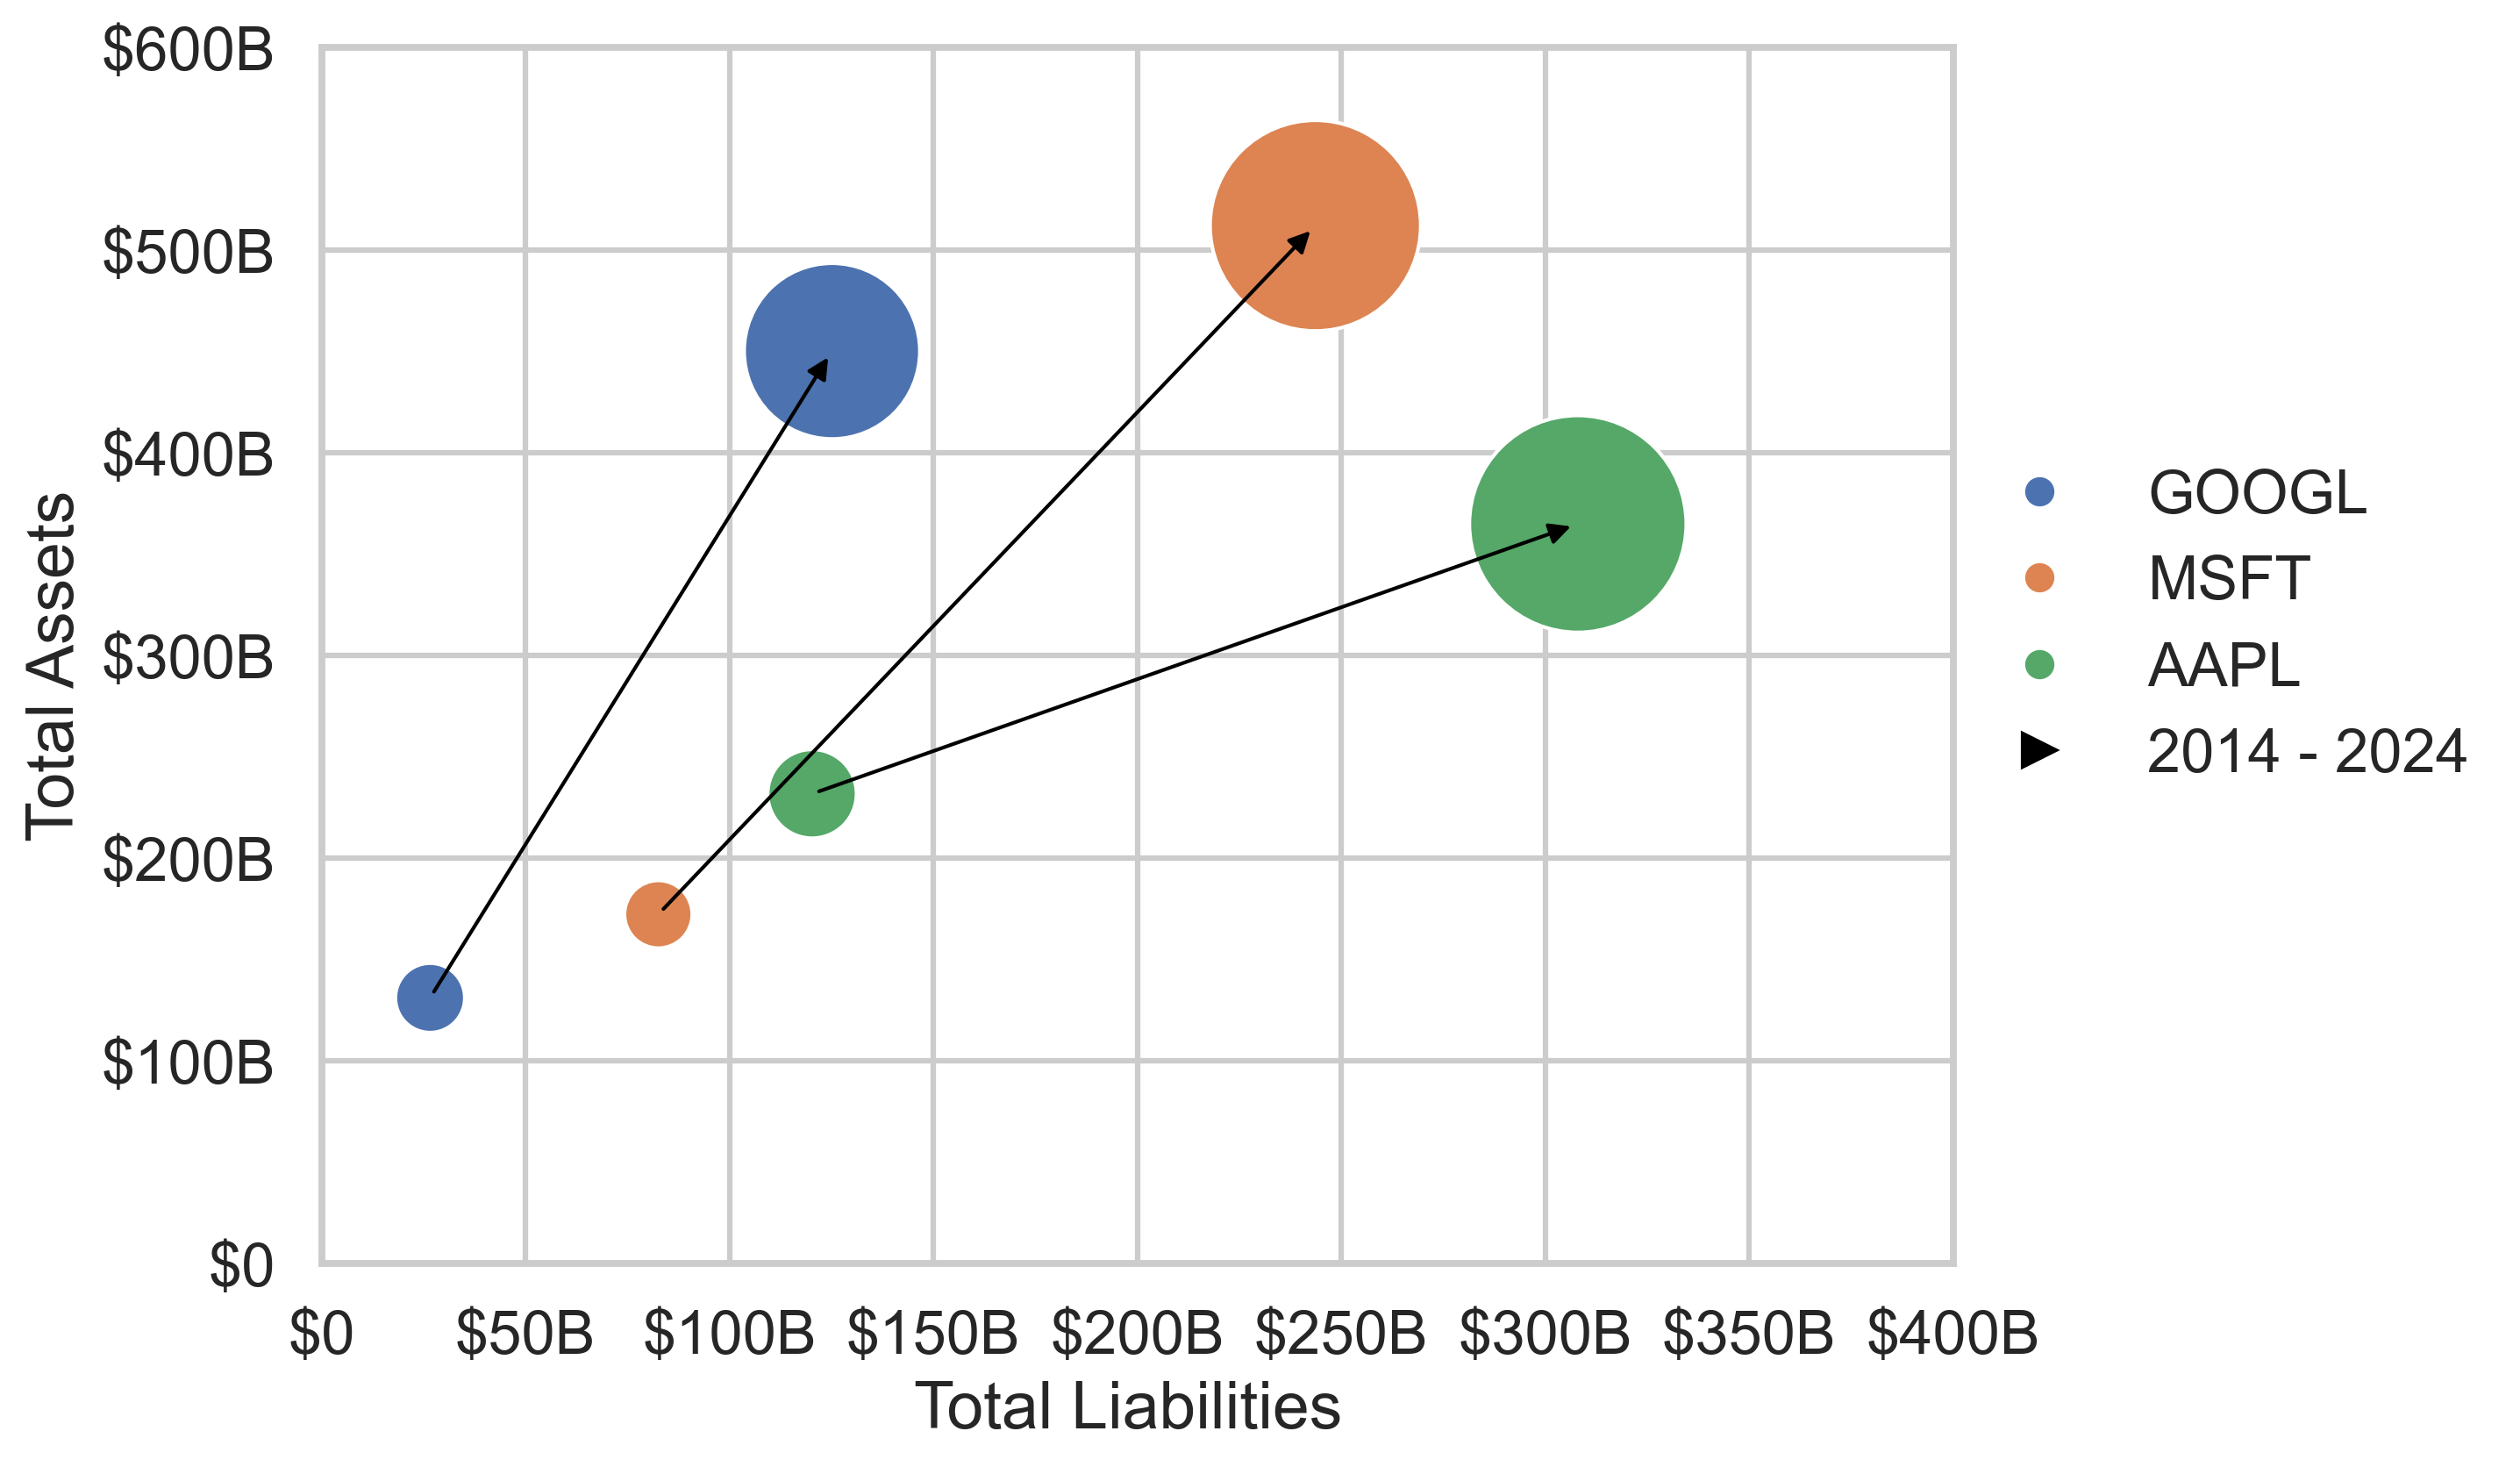
4D Example – 2D + Time + Size
Truncated Axes
Scaled Axes
mean vs median
- Median is “middle” of data
- Mean (expected value) is weighted by values
- Data: https://www.cbo.gov/publication/60706#_idTextAnchor039
Spurious Correlations
- Credit Tyler Vigen
Exploratory Data Analysis
- “You can see a lot, just by looking” ~ Yogi Berra
- EDA establishes understanding of the data before assumptions are made or complex modeling techniques are applied
- More EDA now, fewer mistakes later
- Finds “unknown unknowns”
- Be curious and judgmental
- Skepticism is important, look for errors, bias, misinformation, etc.
combining data
- Combining to get variables from multiple sources
- External data (marketing data, economic data, etc.)
- Various internal systems (invoices, production, etc.)
- Aggregation
- Aggregation can require combining data with itself
- Analysis, cleaning, and verification
- Comparing observations, interpolating, etc.
Relational Database
- Database
- Table 1:
GL_Detail
- Table 2:
Chart_of_Accounts
| journal_id | line_id | account_id | amount |
|---|---|---|---|
| 1 | 1 | 9003 | 500 |
| 1 | 2 | 2002 | 500 |
| 1 | 3 | 9500 | 350 |
| 1 | 4 | 4002 | 350 |
| account_id | account_name |
|---|---|
| 1000 | Cash |
| 2002 | Receivables |
| 4002 | Inventory |
| 8002 | Retained Earnings |
| 9003 | Revenue |
| 9500 | COGS |
SQL: Structured Query Language
- SQL is the language used to interact with RDBs
- SQL playground: sqlbolt.com
- Do you need to know SQL?
- You should understand conceptually the moving parts
- You should understand what it can and can’t do
- Which you can ask LLMs
- Learn it if you need it, are interested, or taking the ISC section of the CPA
Inner join
- Just keep rows that match (join keys are in both tables)
- Most common join (JOIN keyword in SQL is inner)
Outer join
- Keeps all rows from both tables
- Rows that do not match other table are filled with missing (NULL)
- Can create large datasets
| NULLs | |
|---|---|
| NULLs | |
Left/Right join
- Keeps all rows in one table
- Used to add columns from another table without altering original rows
- Left and right join are the same with swapped table orders
- A
left joinB = Bright joinA
| NULLs |
Aggregations
- Calculations across multiple rows
- Counting, summing, averaging, regressions, etc.
- Aggregations collapse multiple rows into one
- Often combined with merges
- E.g. total expenses by vendor within date range
- Often done in “subquery” and merged
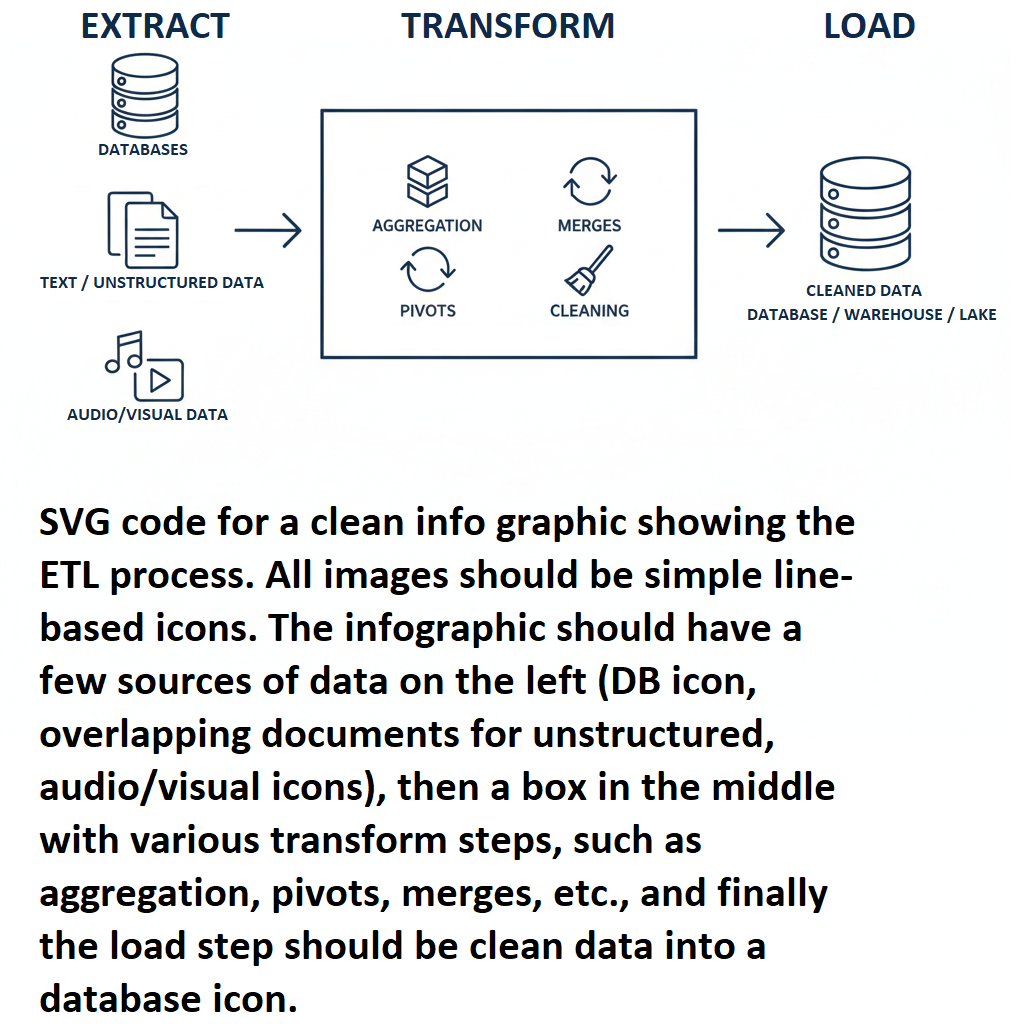
Extract, Transform, Load
- Acquiring data needs to be robust and repeatable
- Extract
- Ingest data
- Transform
- Clean and format data
- Load
- Save data to storage
Automating Data Use
- Dashboards, KPIs for decision makers
- Continual process analysis, internal audit
- Robotic Process Automation (RPA) to achieve specific tasks
- Small one-off tasks (filing PDFs, scraping data, etc.)
Human in the Loop
- RPA can’t handle un-known circumstances
- Well it will, but you probably won’t like it
- Human in the loop is when your process calls a human for help
- Important decision oversight
- When something goes wrong
Common RPA Uses
- Accounts Payable (procure-to-pay): automate invoice processing (OCR) and vendor payments
- Accounts Receivable (order-to-cash): automate invoicing, billing, and collections
- Data Acquisition: automate downloading data, client files, etc.
- Account Reconciliations: automatically reconcile financial accounts and ledgers, 100% testing, flagging errors for review
- Report Generation: automate pulling, processing, and formatting of data into regular reports
- Payroll & HR expenses: validate timesheets, initiate direct deposits, employee expense reimbursements
What to do with our data?
- Once we have data, what then?
- Use it!
- Model the world
- Descriptive: What happened?
- Diagnostic: Why did it happen?
- Predictive: What will happen?
- Prescriptive: What should we make happen?
Healthy Skepticism
- Analytical models can be very powerful
- But that doesn’t obviate your professional skepticism
- Apply your domain knowledge
- Question the assumptions
- Question the model
- Question the data
Garbage in, Garbage out
- Random errors (called noise) results in worse measures and outcomes, but randomly
- E.g. predicting default risk inaccurately
- Errors all in the same direction (called bias) can result in consistently wrong results
- E.g. always underestimating default risk
- Minimize noise, beware bias
Correlation is not Causation
- Important to differentiate when making decisions
- Causal inference is designed to identify causation
- Has its own caveats, but better than nothing
Model interpretability
- Machine learning is great at capturing correlation
- ML models are often impossible to understand
- Understanding a model is important to understanding when it will work and when it won’t
- E.g. ChatGPT seems to be able to “think” until you come across non-existent citations
- Accountants must justify their work
- To auditors, investors, regulators, etc.
Business Significance
- Statistical significance: high certainty in the model
- Economic significance: how many dollar signs?
- Remember that models don’t have business sense
- Important to translate model conclusions into economic impact on costs or revenues
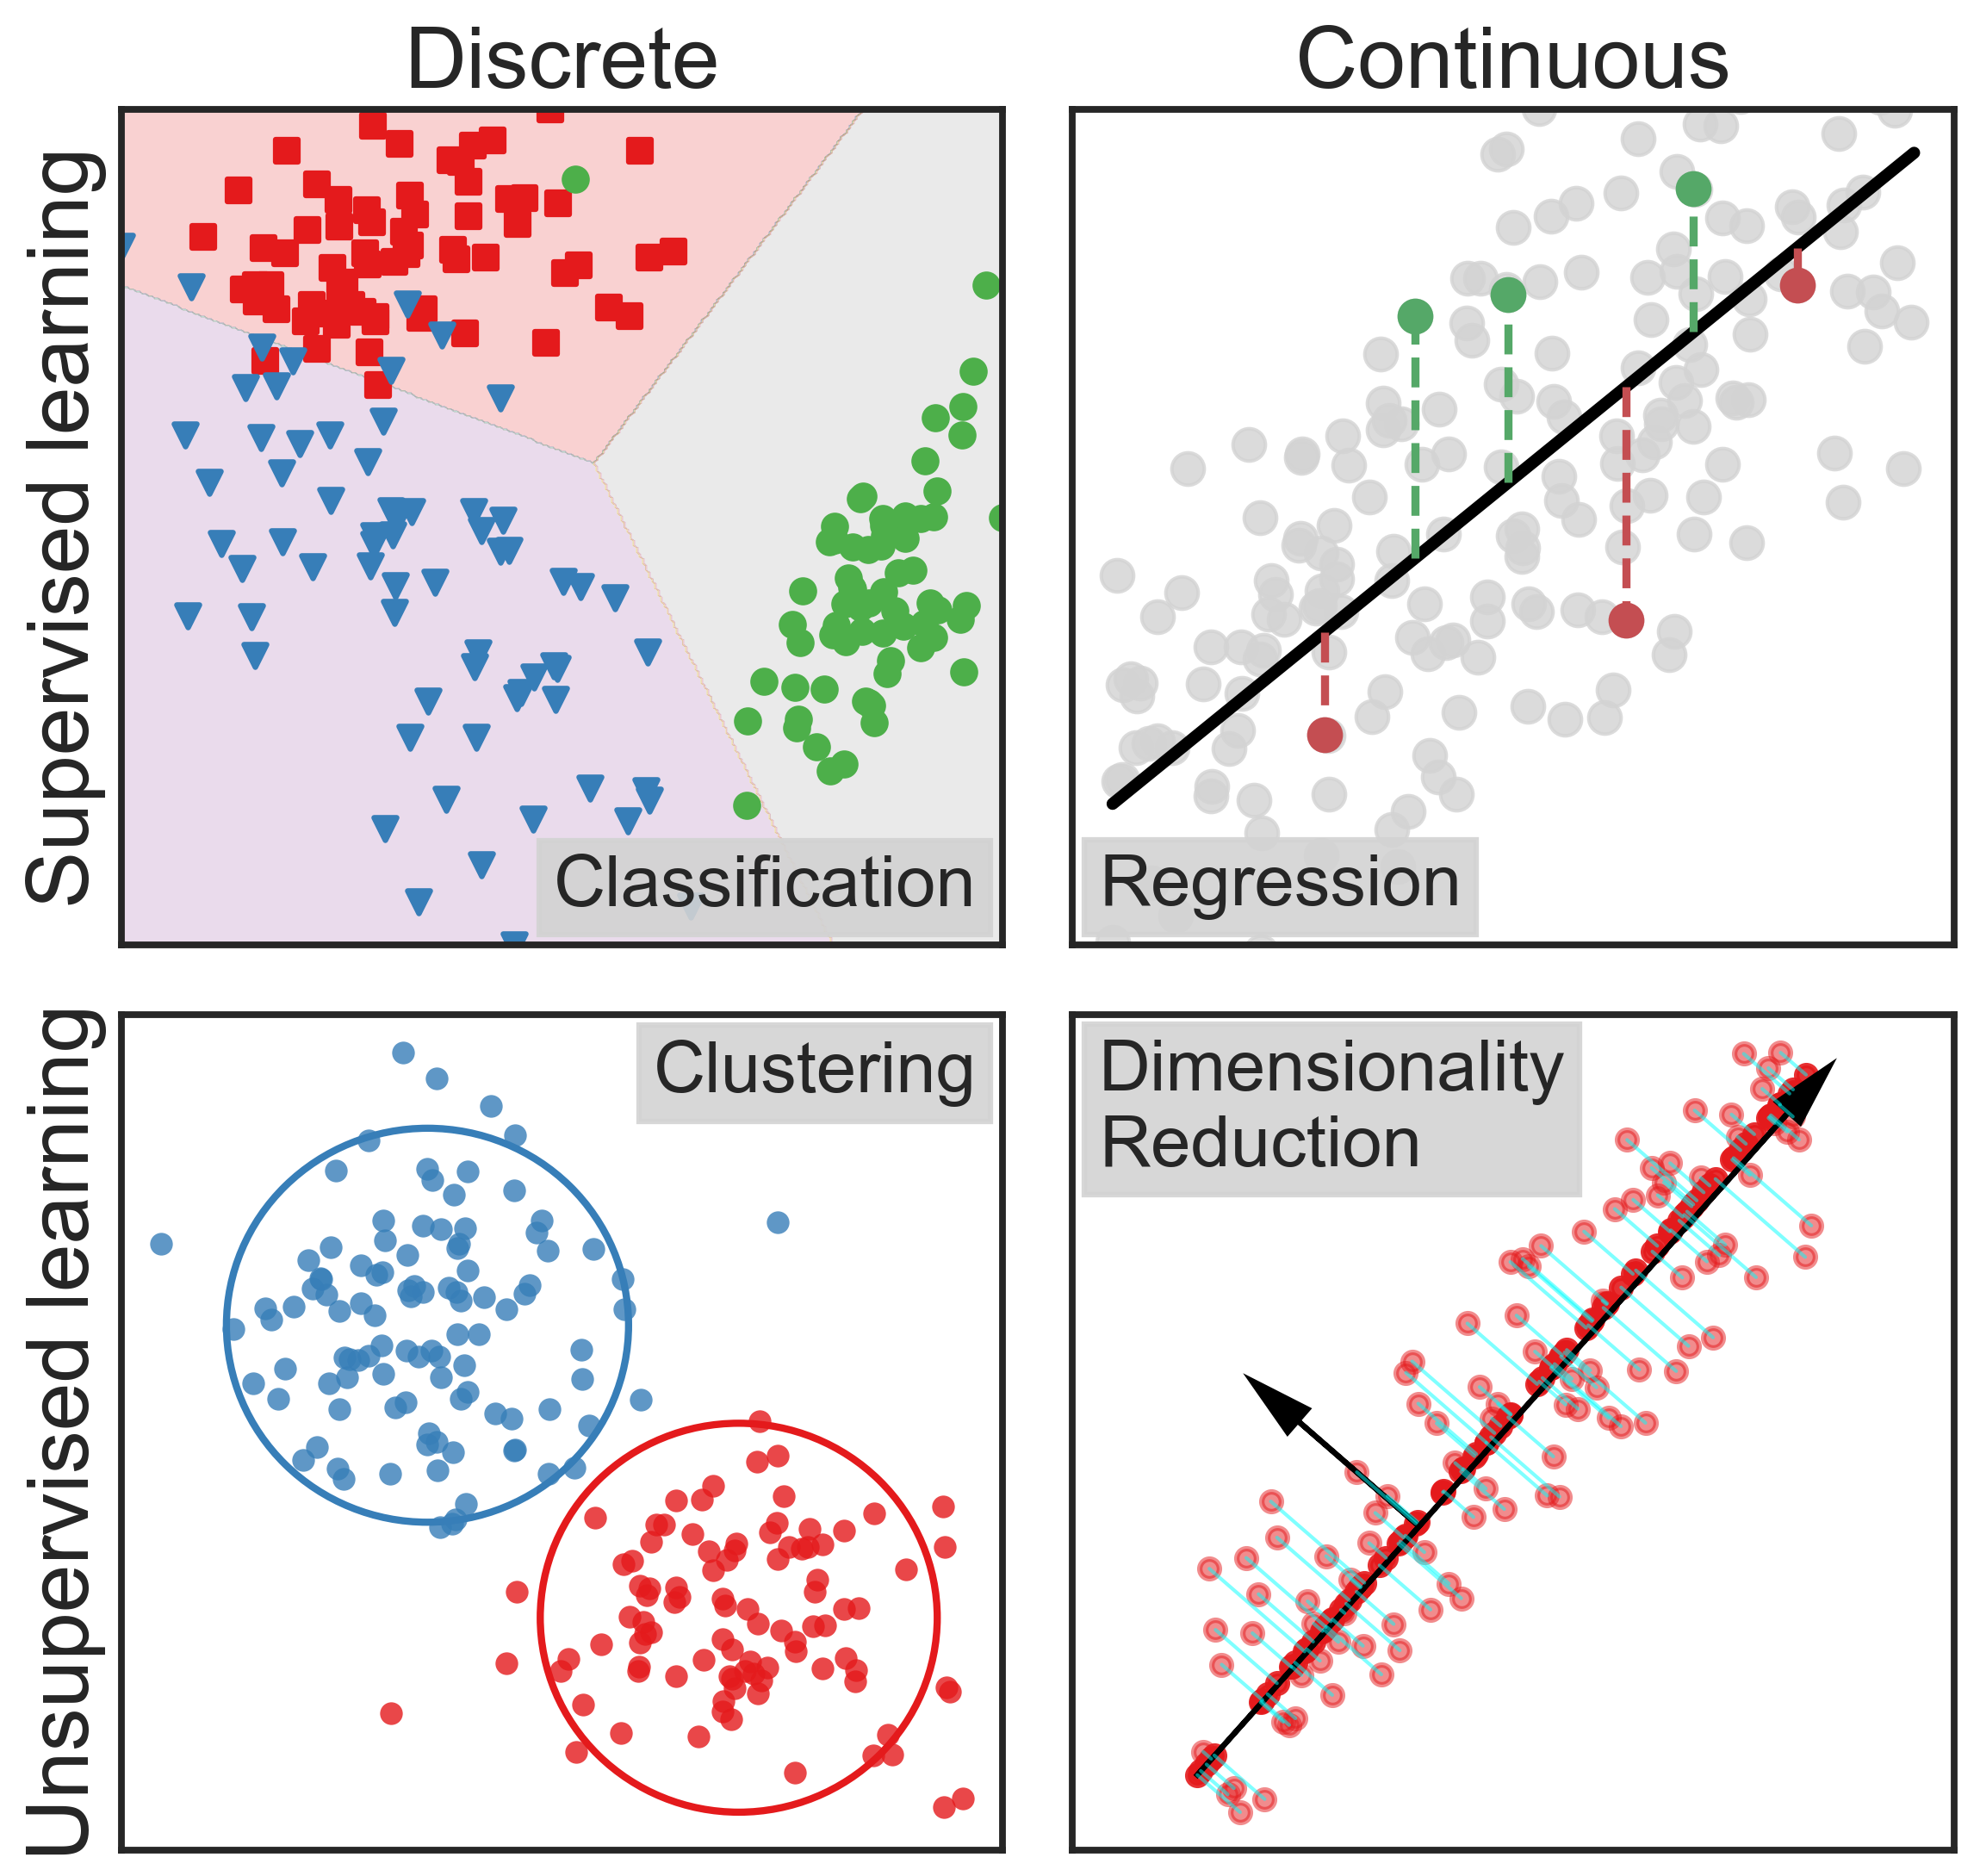
Categorizing Analytical Methods
Fitting Lines and Errors
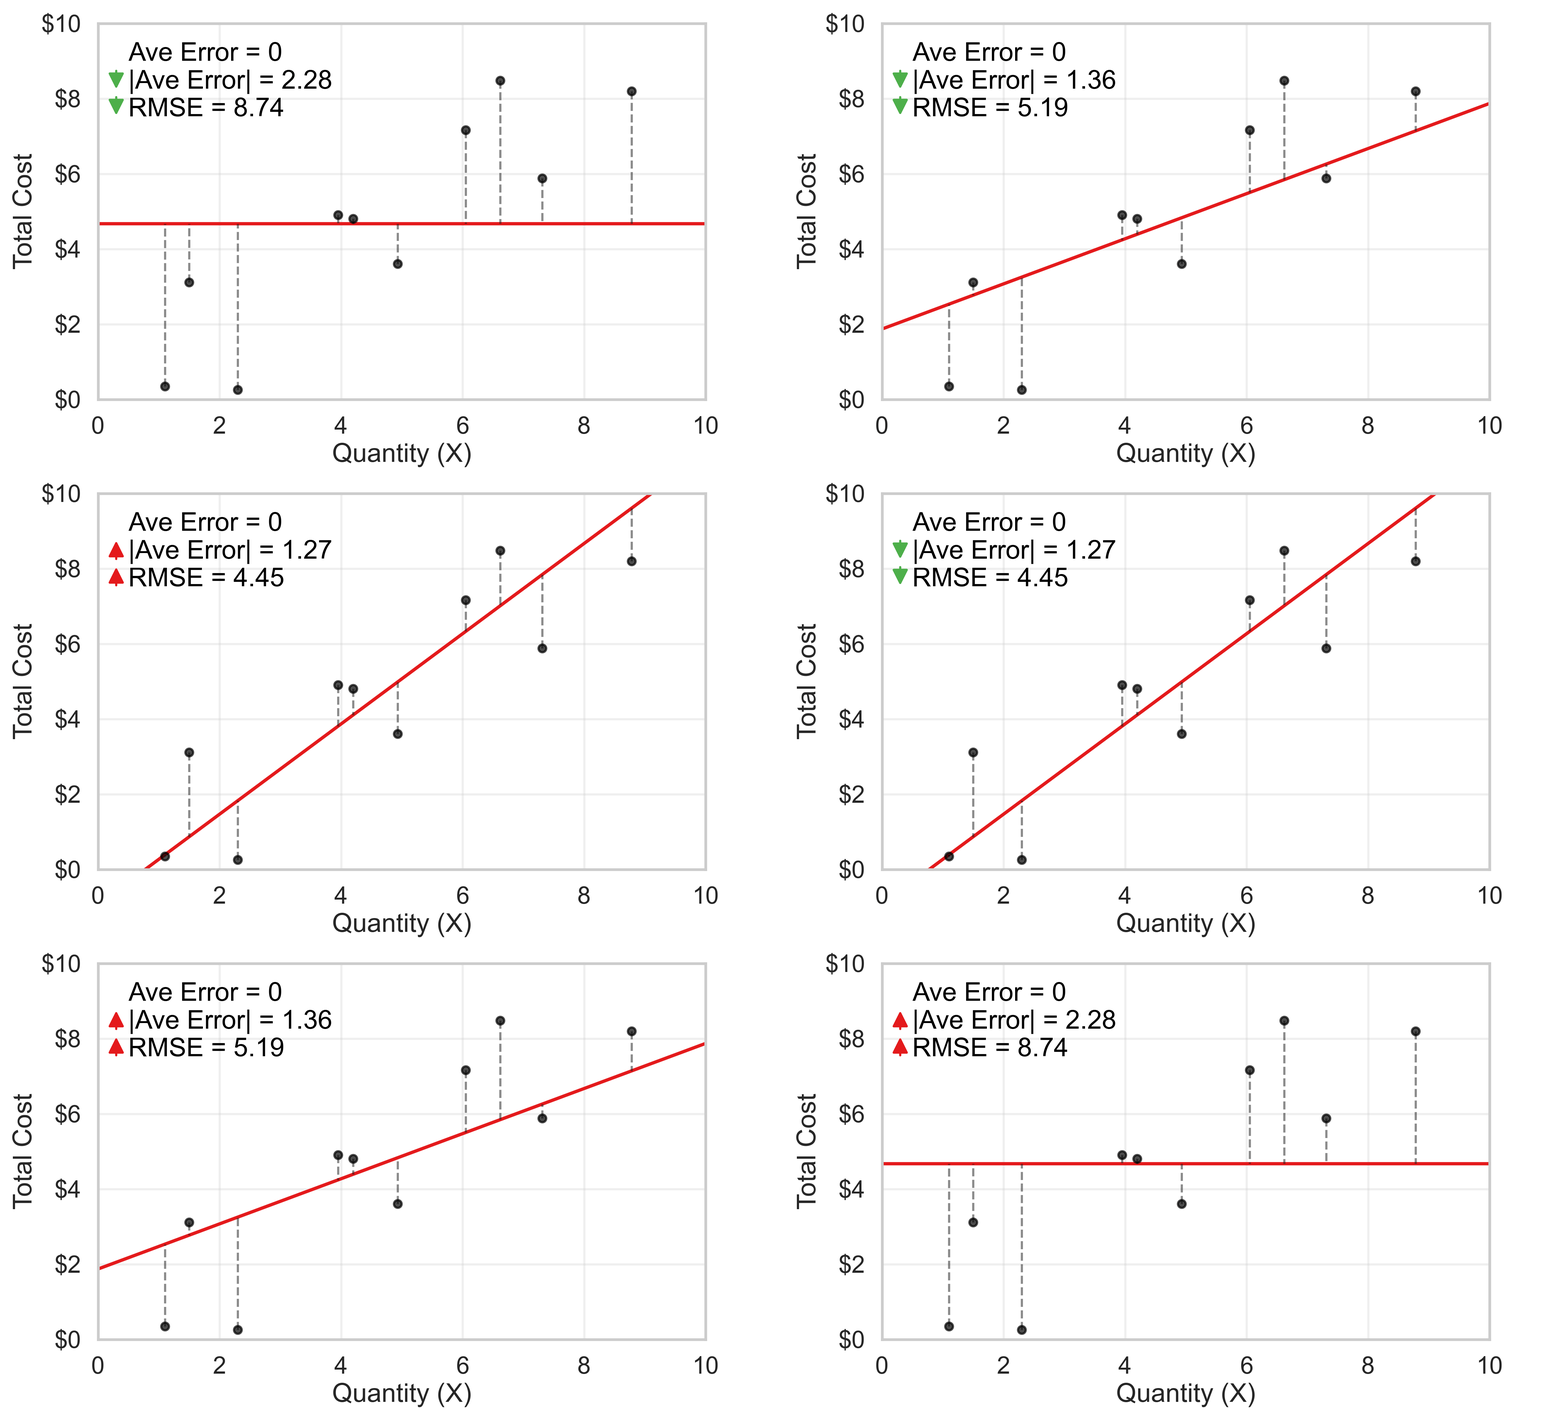
What is a good fit?
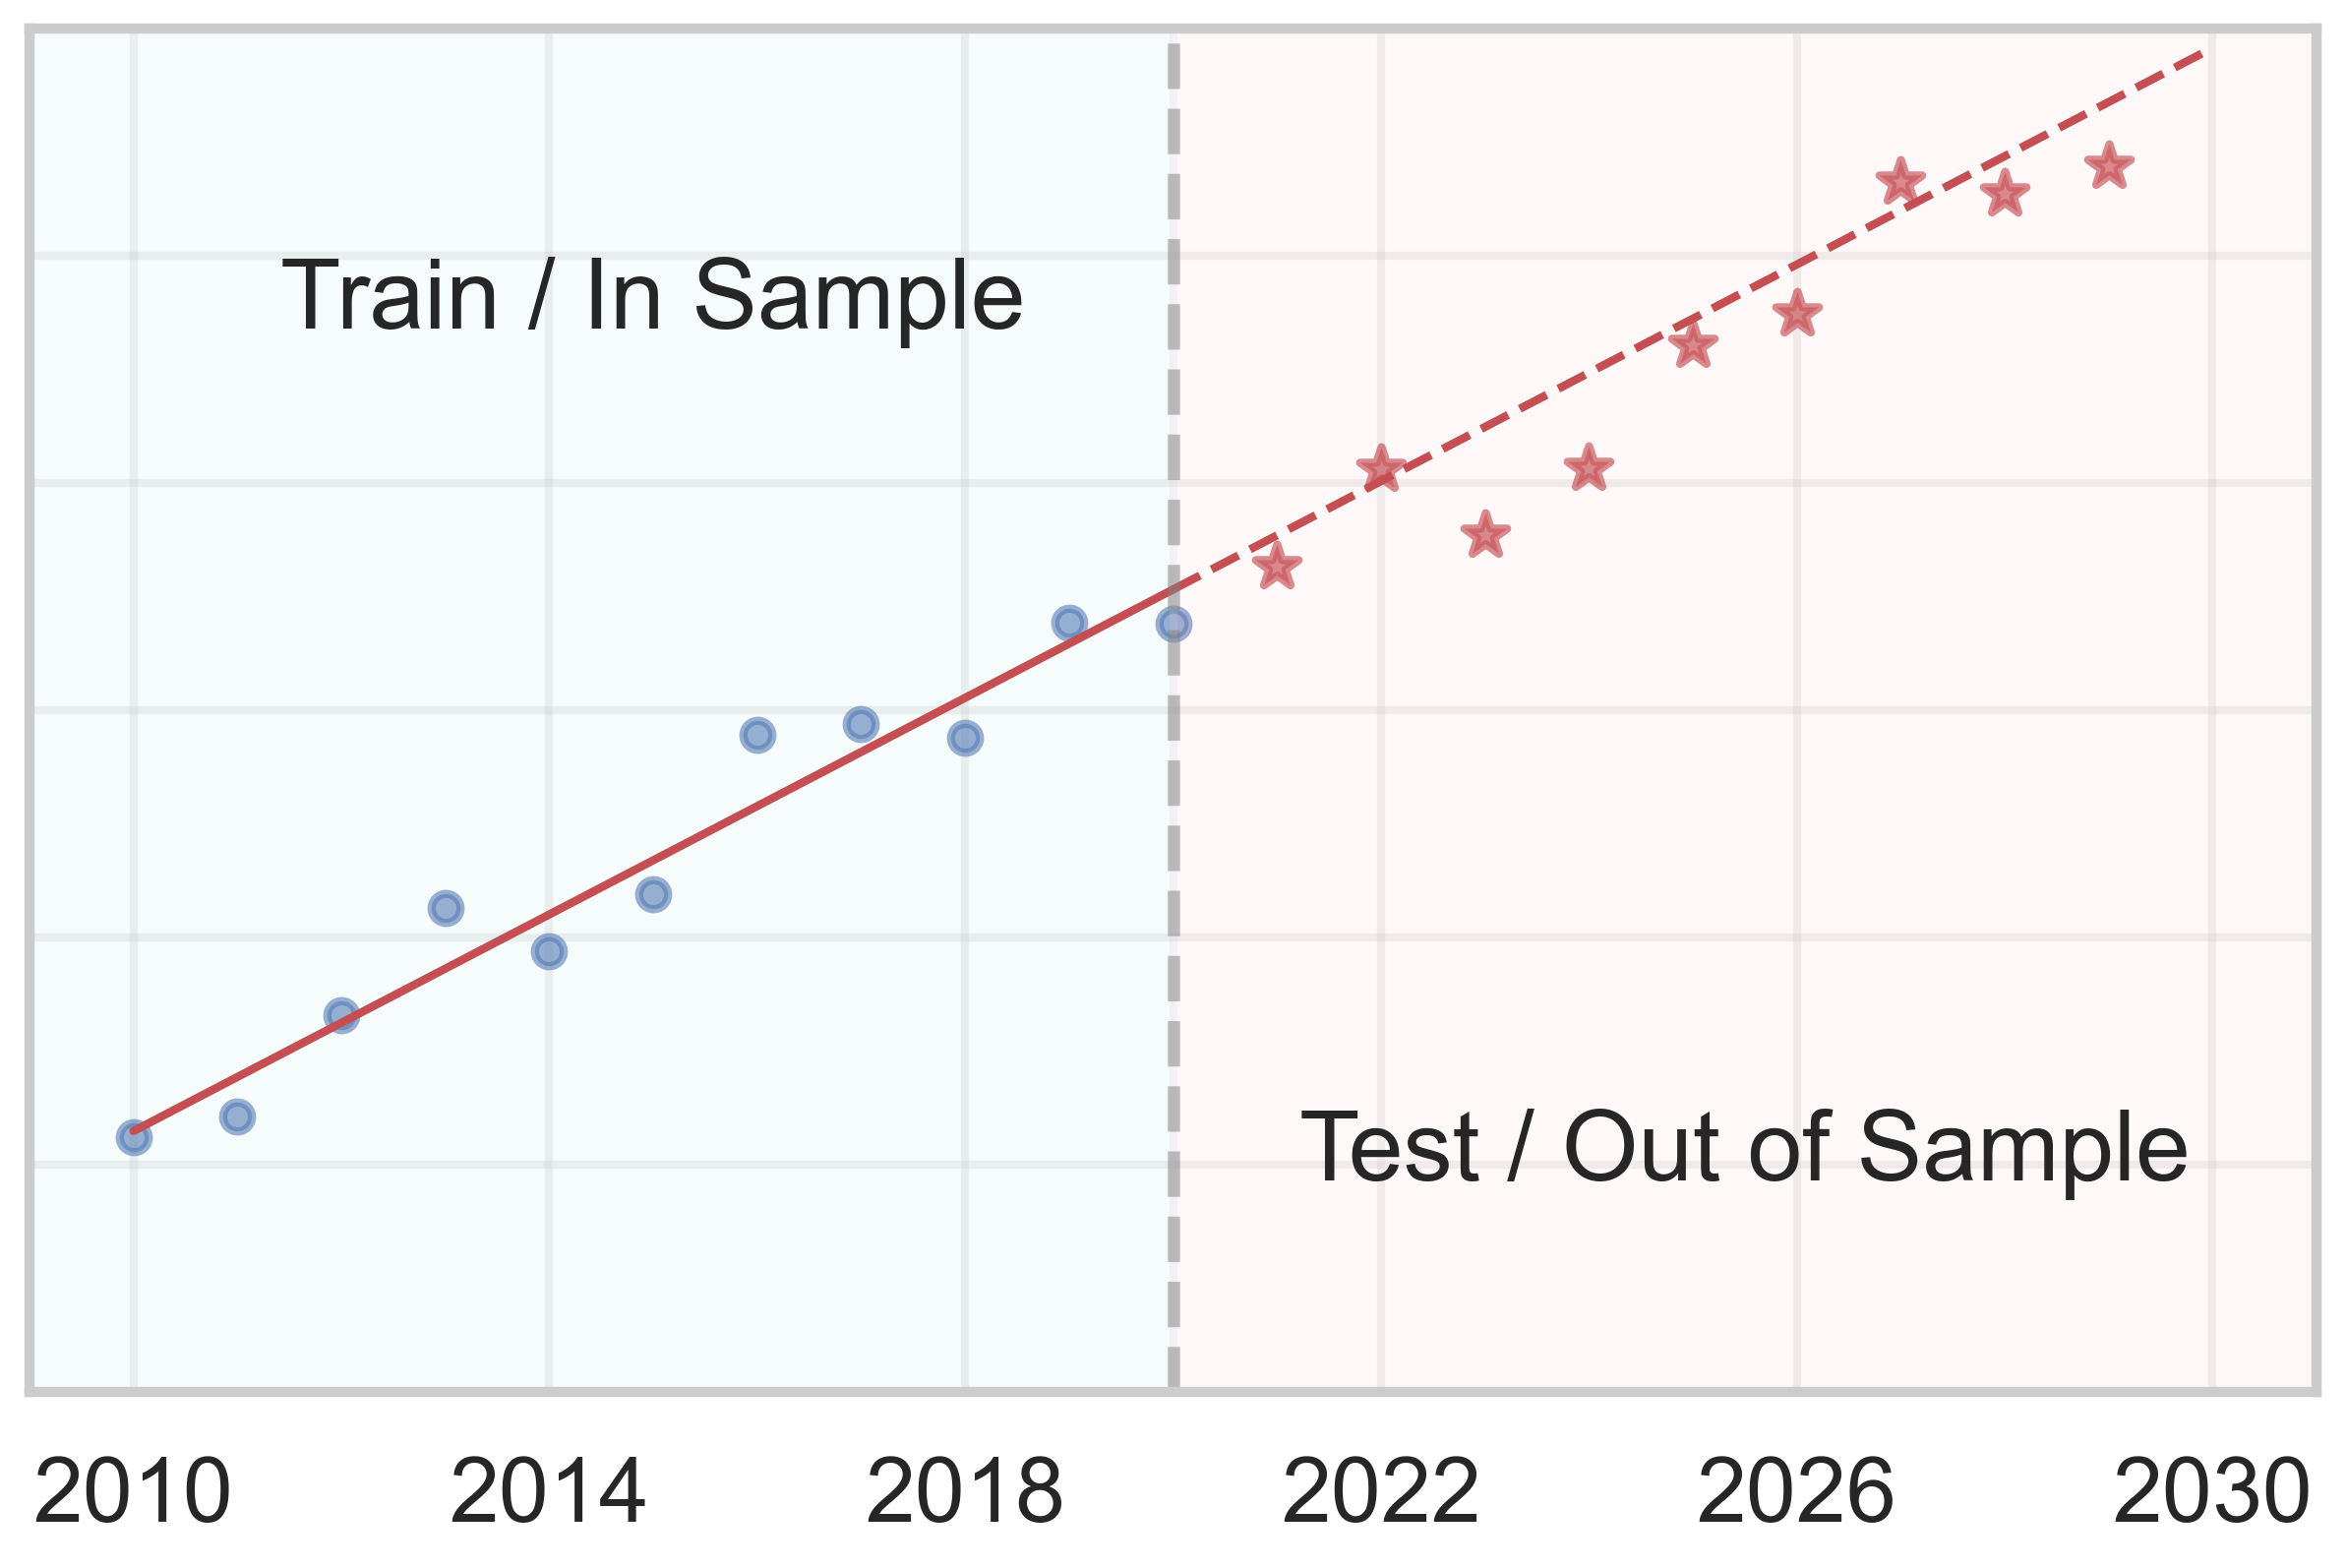
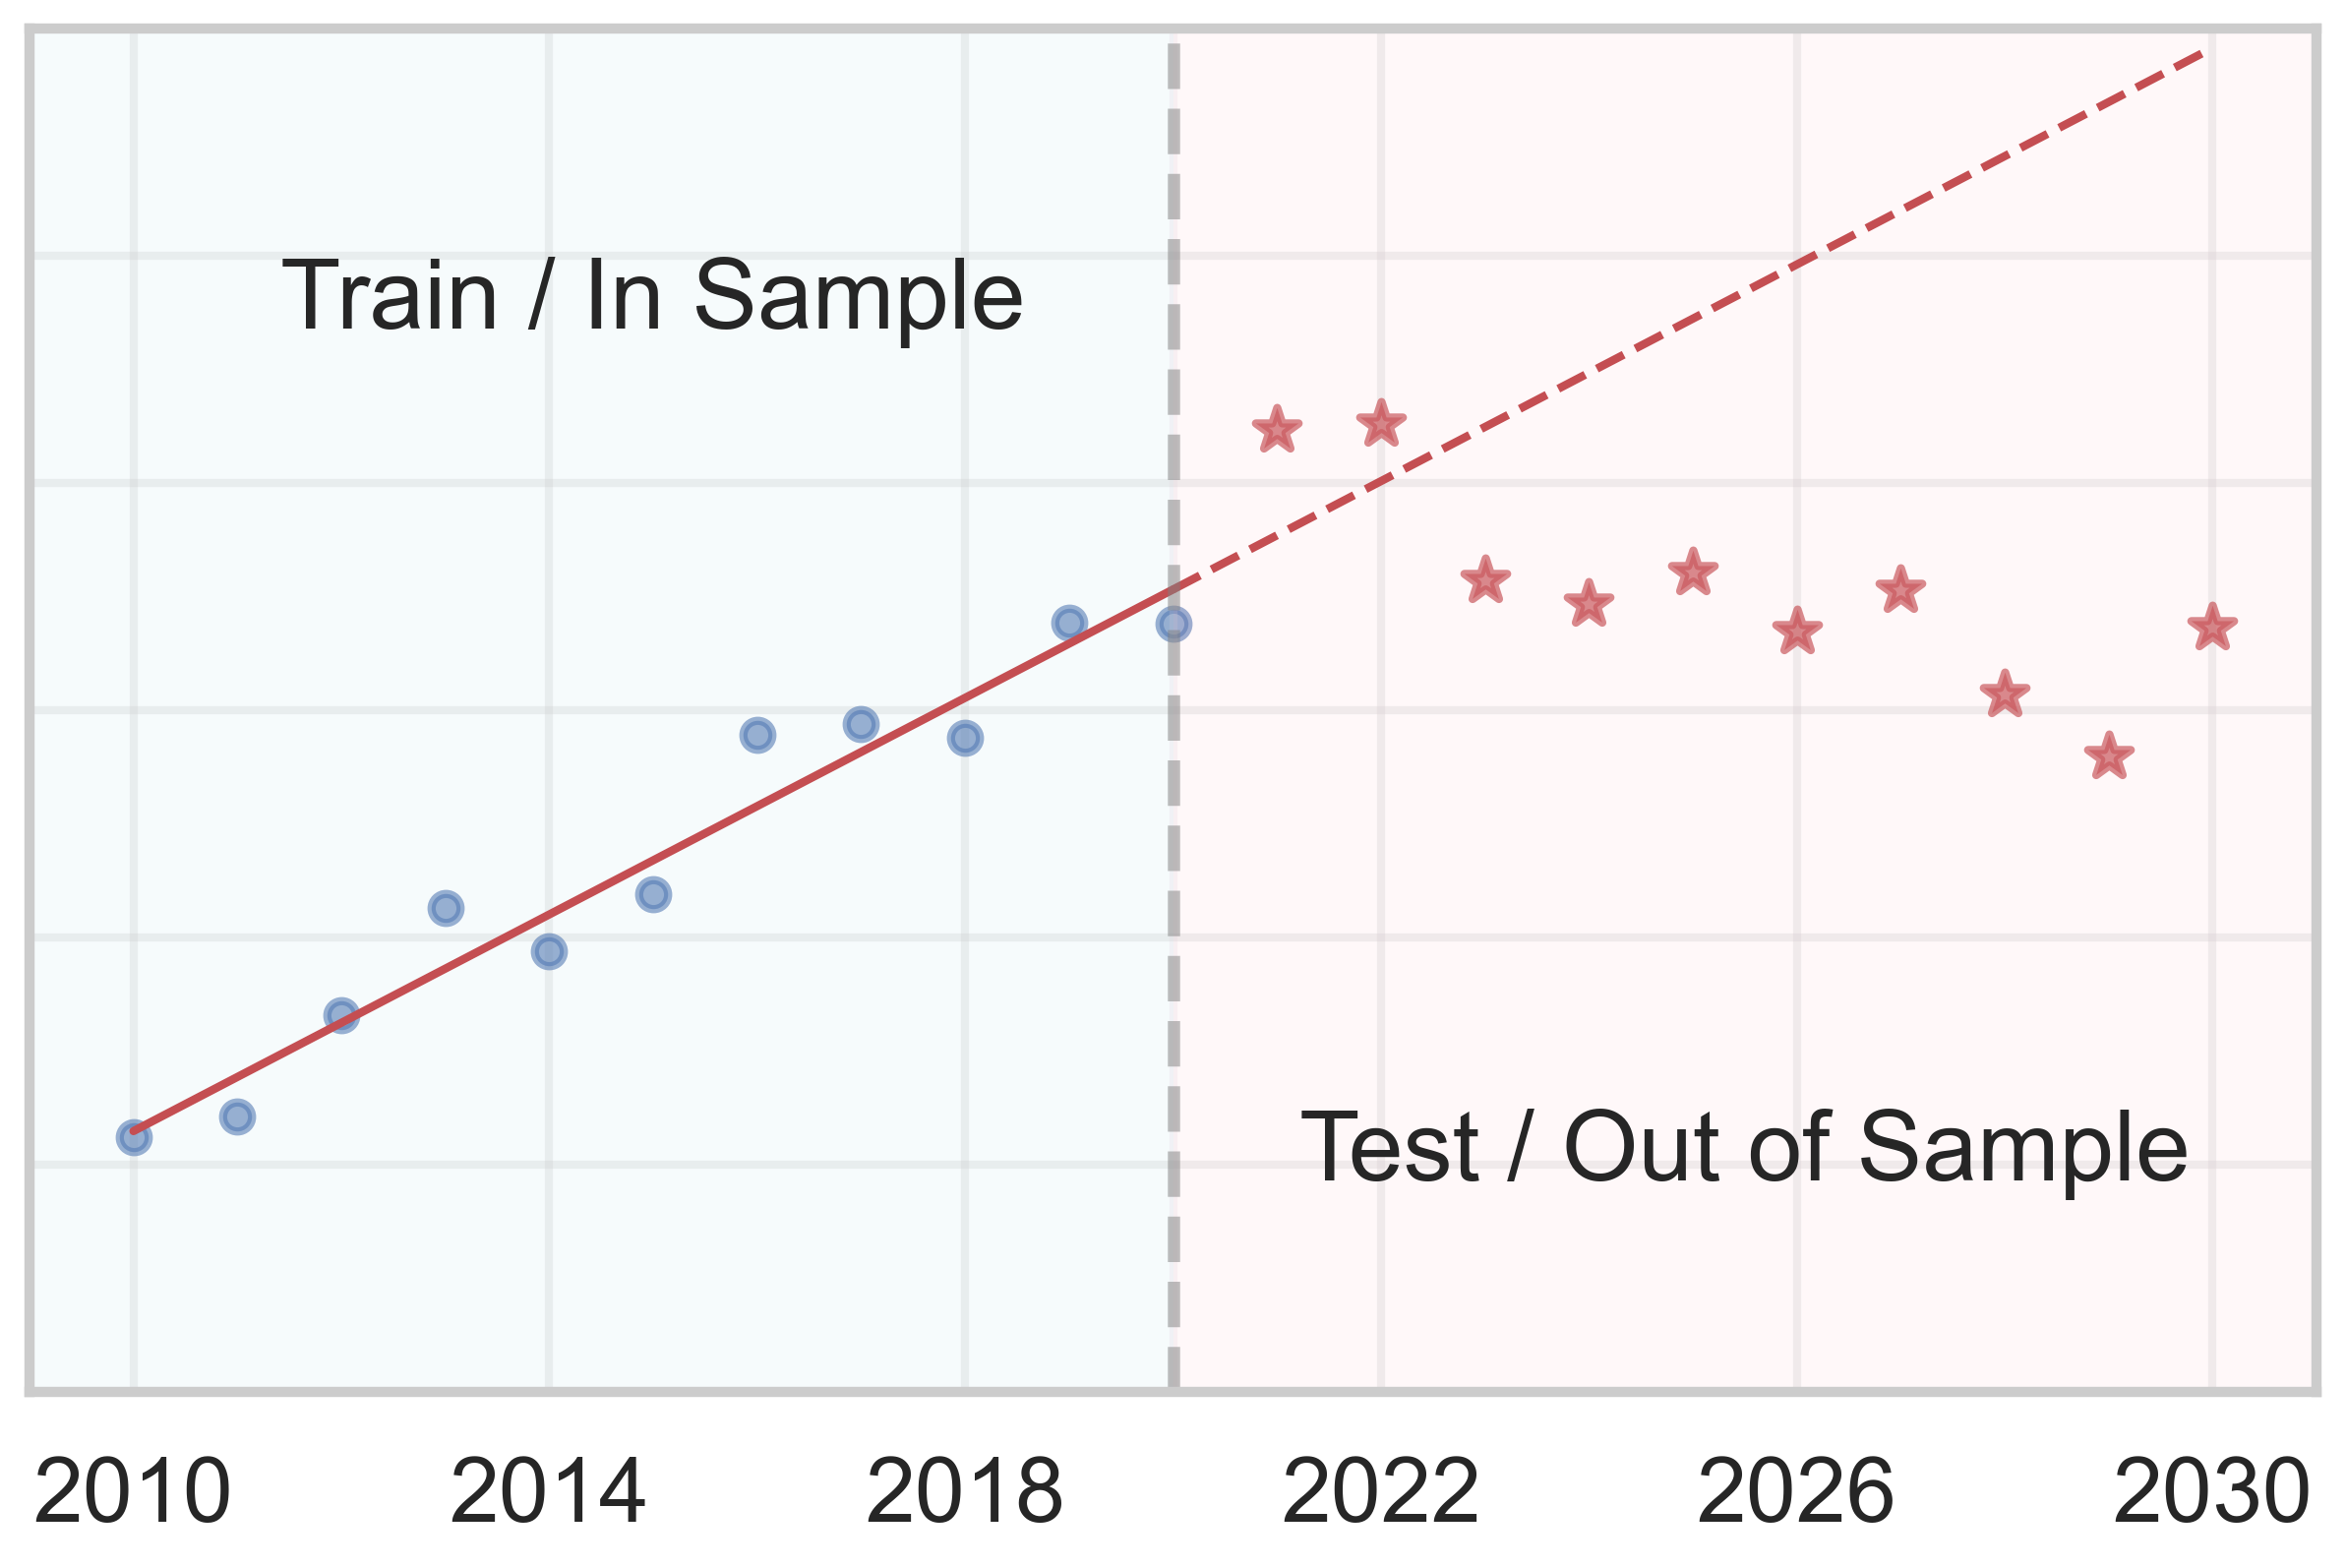
- How well does the model describe the data you have
- Called in sample fit, based on training data
- How well does the model predict new data
- Called out of sample fit, based on test data
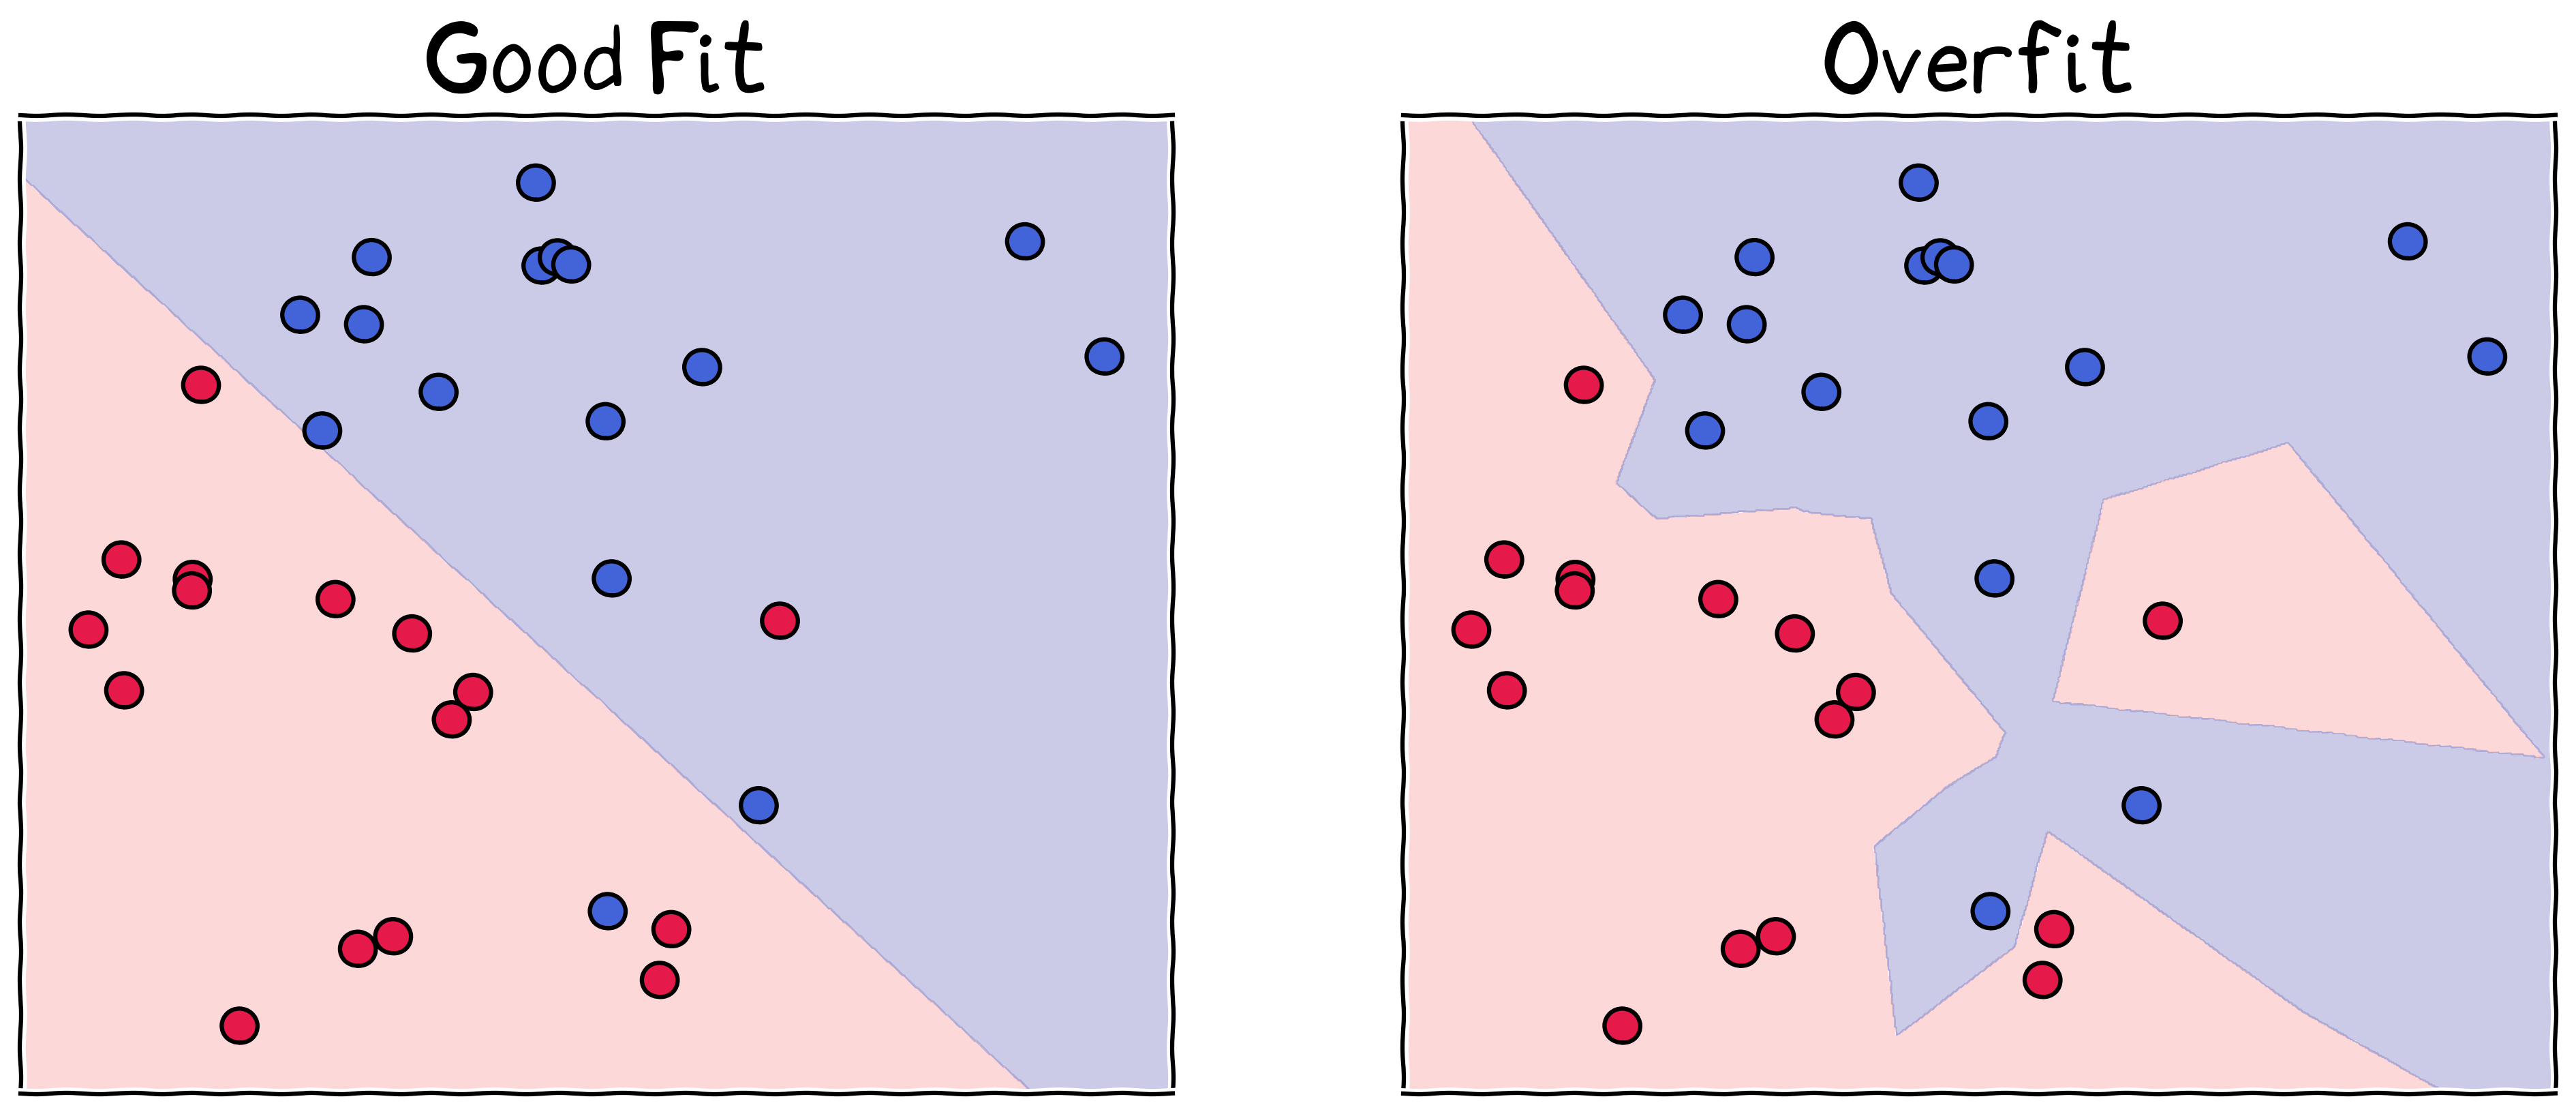
Overfitting: too much of a good thing
- Some models can just memorize the training data
- Does not mean they have learnt the “truth”
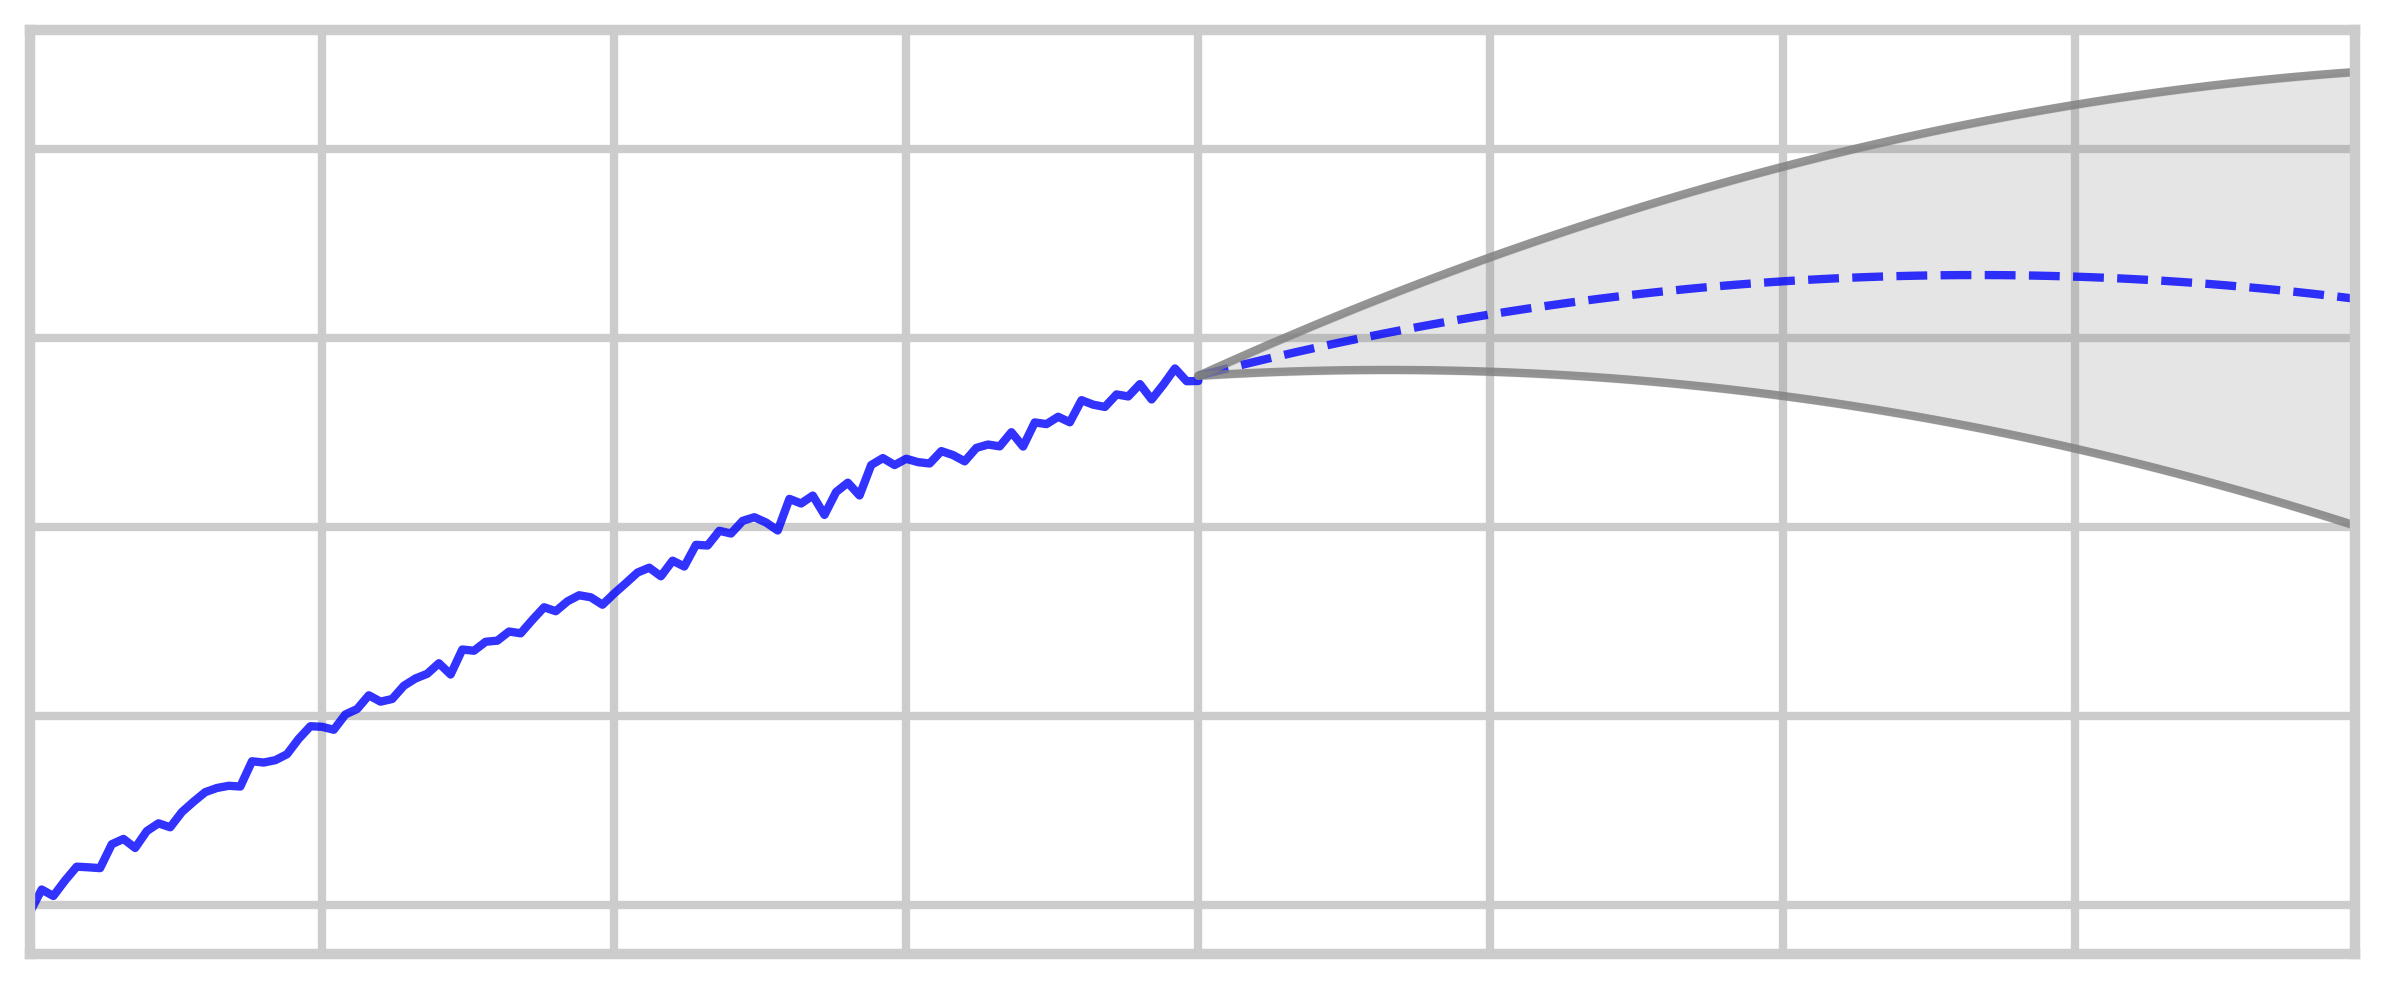
Time-series data – Forecasting
- Each observation is related to the next
- Order matters
- Example: Revenue data over time
Forecasting Cautions
- Training data could contain random economic events that aren’t indicative of the future (overfitting)
- New economic events that aren’t modeled can occur (underfitting)
- Uncertainty increases when forecasting further out
Causal Analysis
- Compare outcome to “counterfactual”
- Anything that is different between treatment and control could potentially cause the estimated effect
- Called omitted variables or measurement error
- Solutions to identify causality limit generalizability
- If you can’t define how treatment results in outcome (the mechanism), be very skeptical
- If you can, then that’s potentially testable
Classifier vs Regression?
- Regression Approach
- Classification Approach
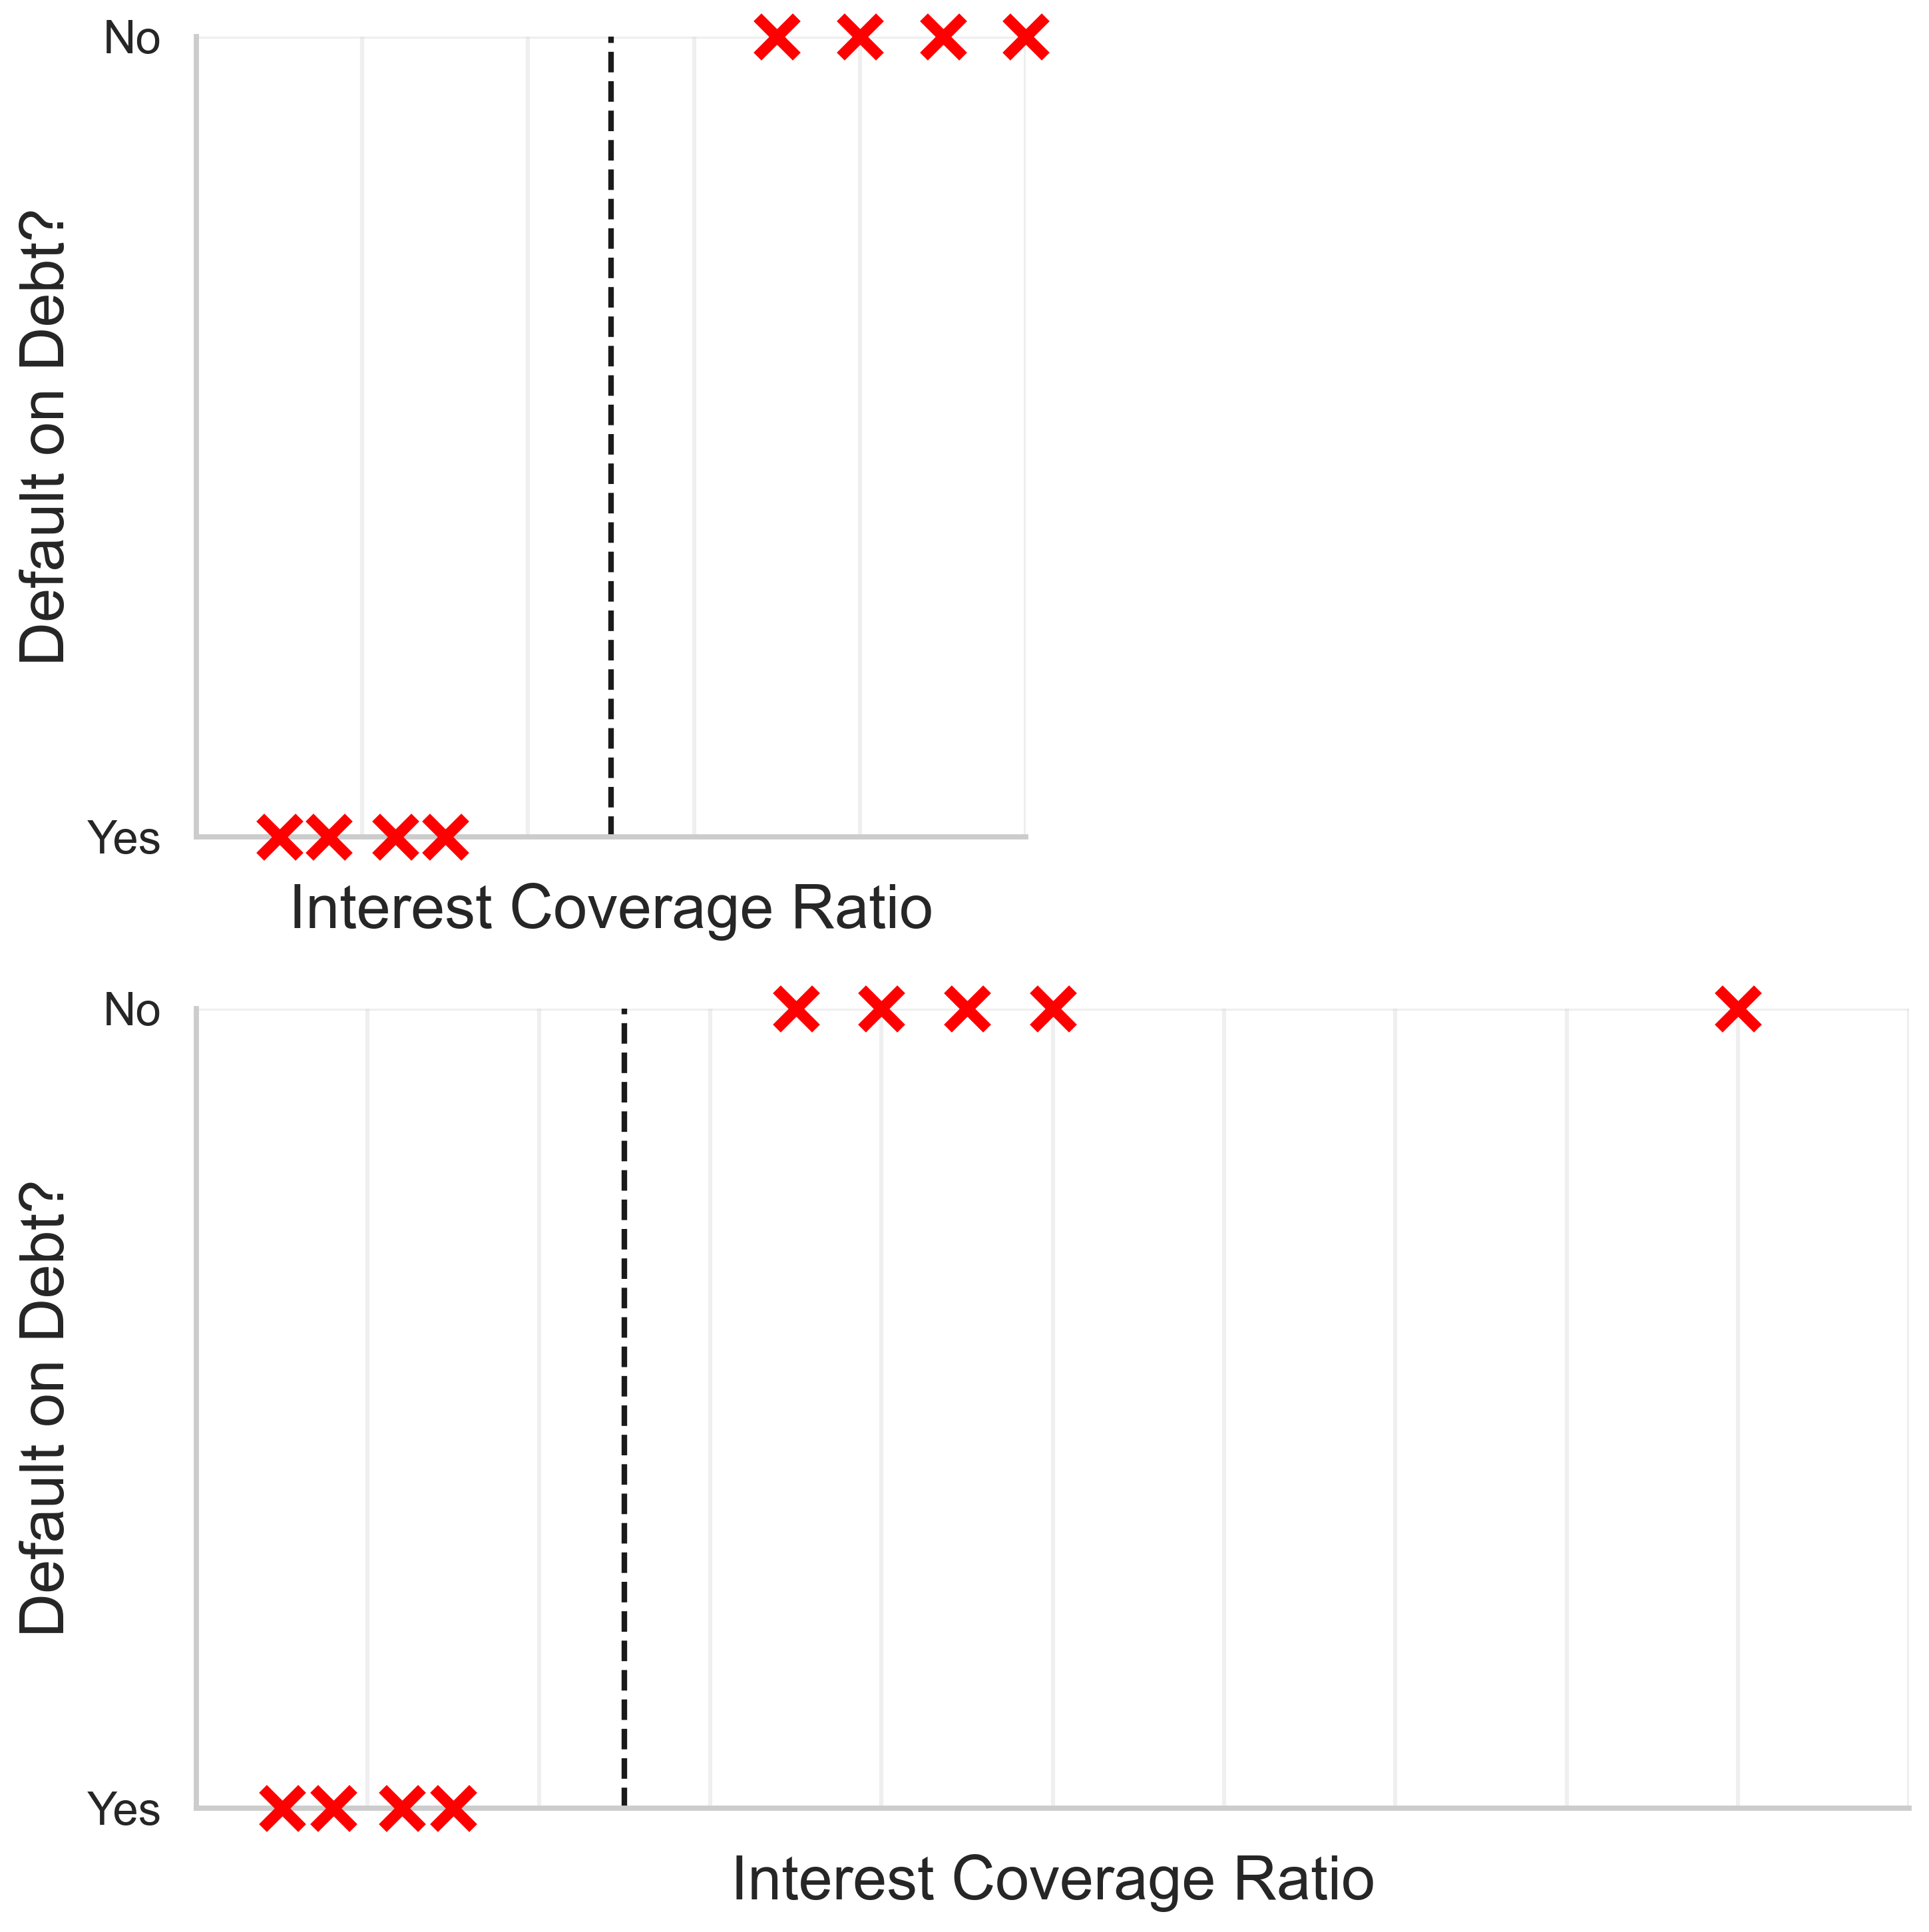
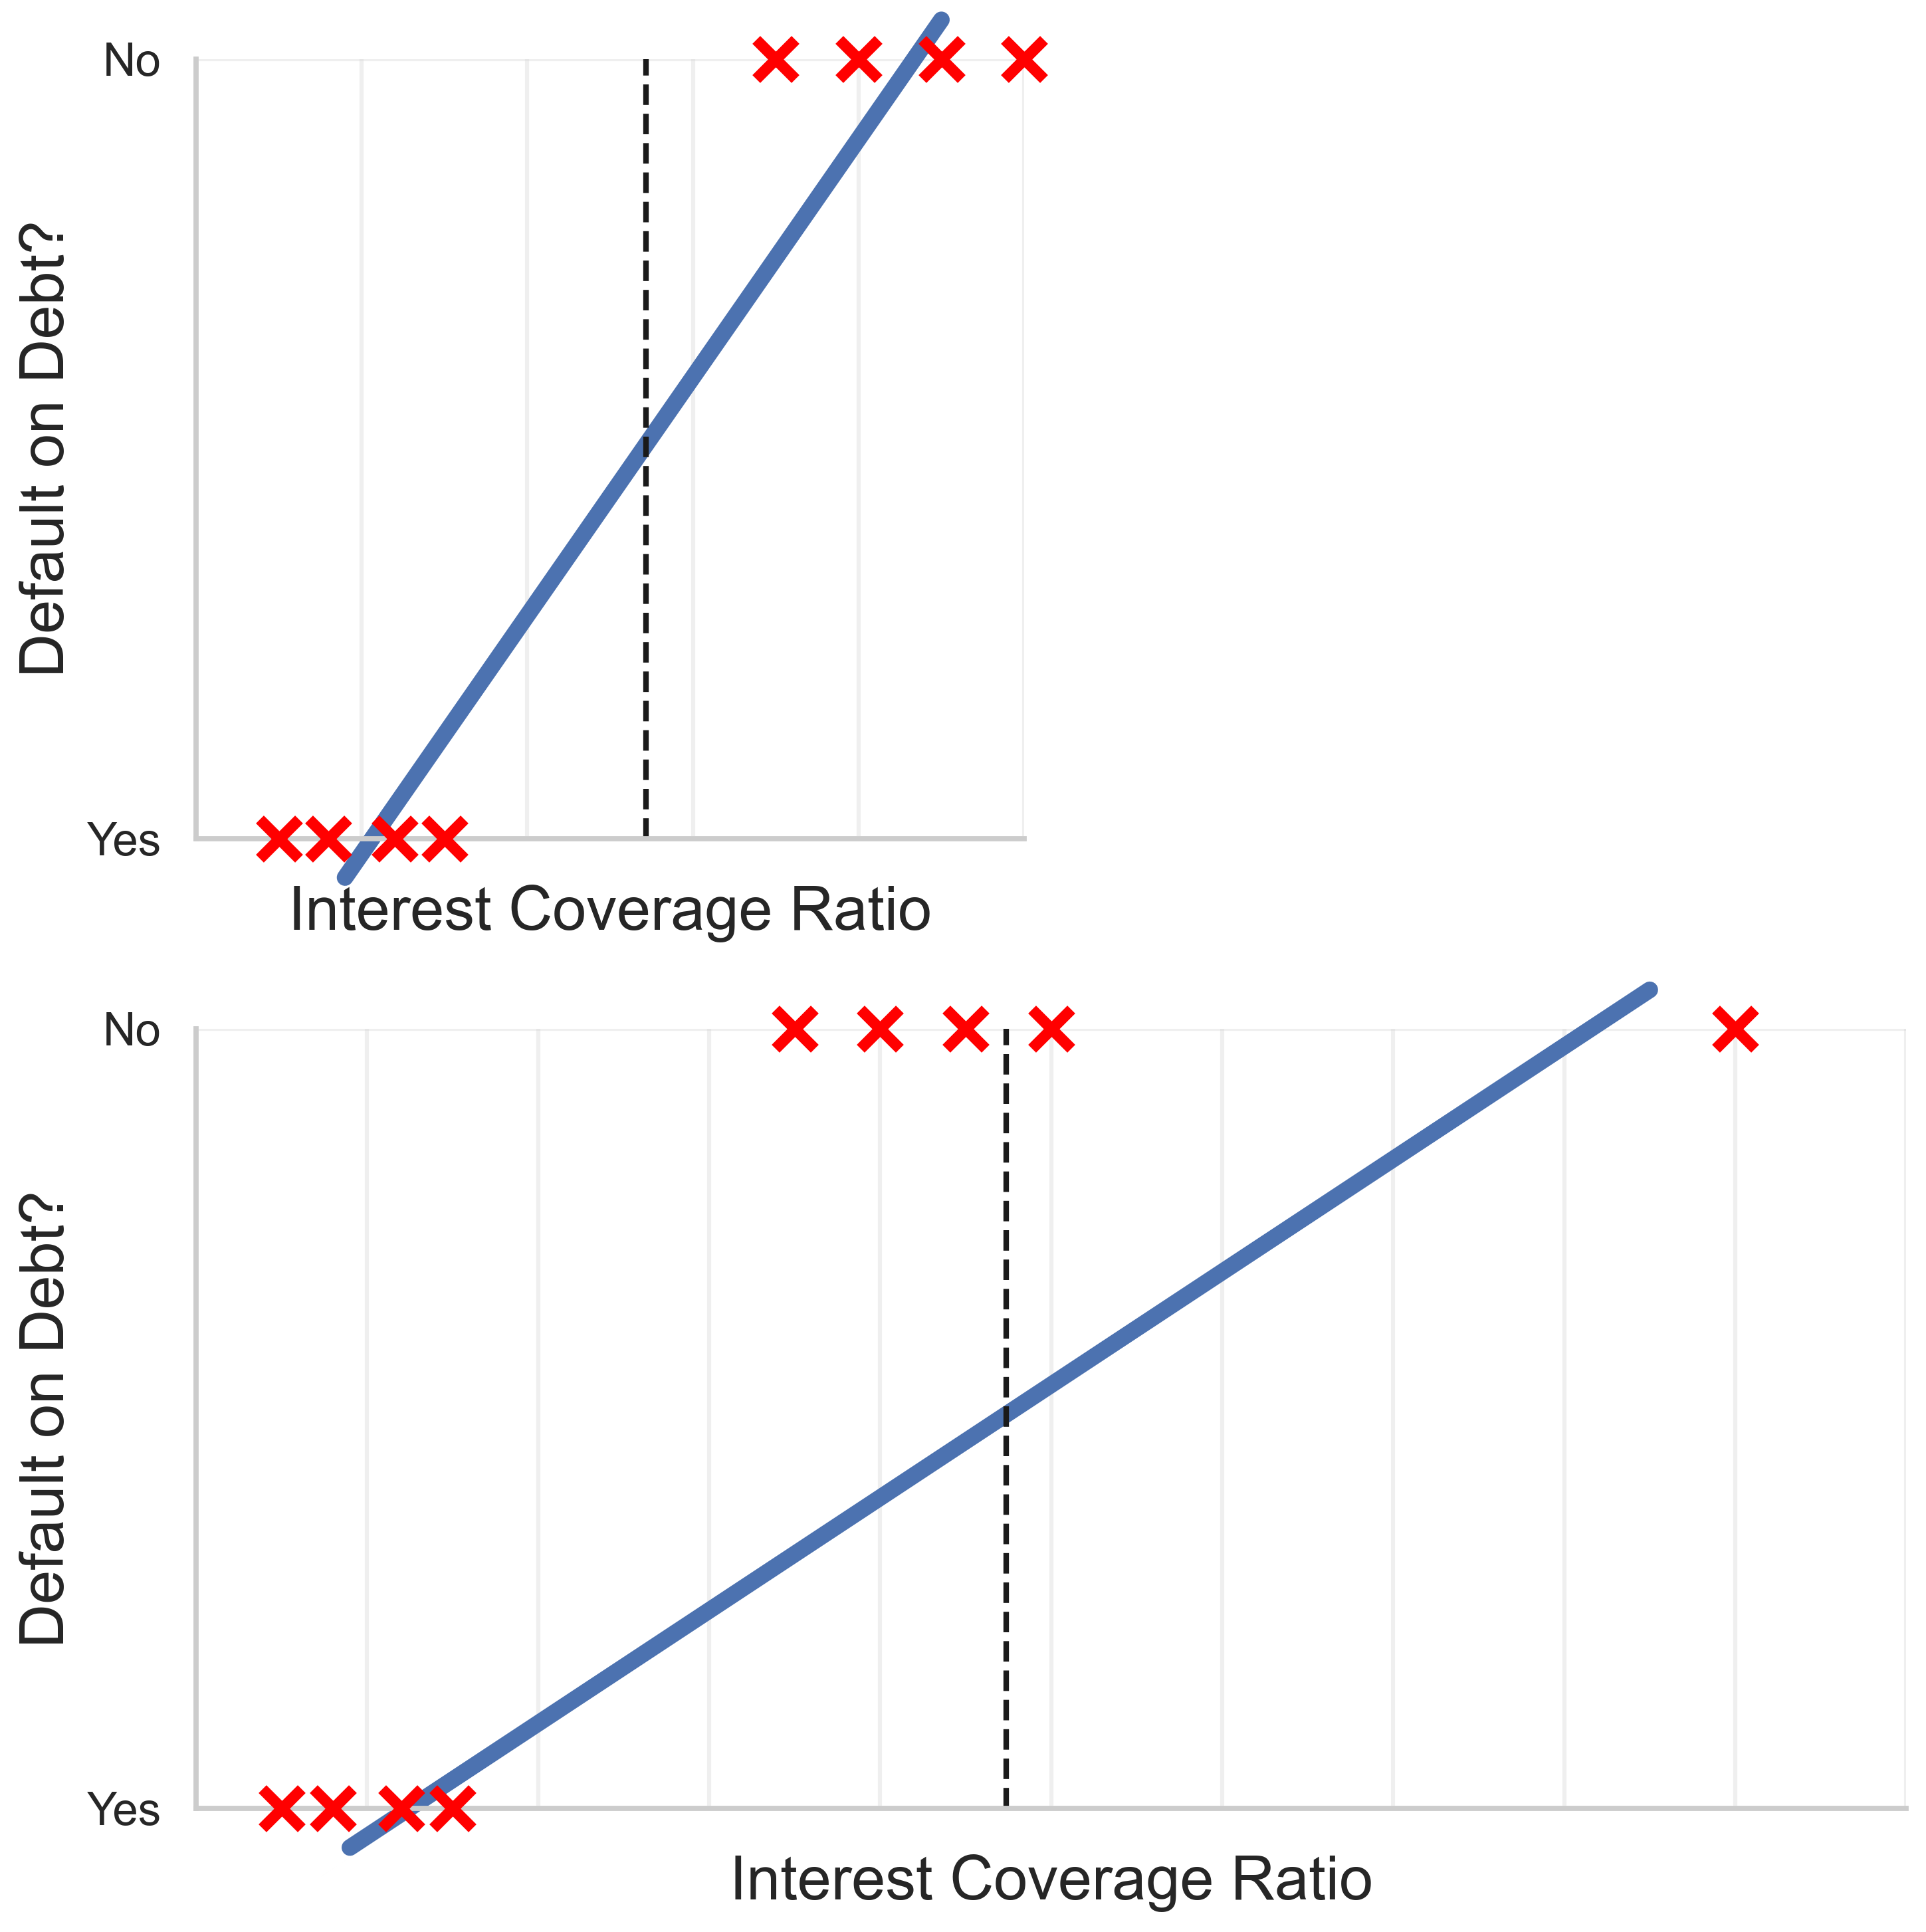
Confusion Matrix
| Outcomes | |||
|---|---|---|---|
| Is Positive | Is Negative | ||
| Predictions | Predict Positive | True Positive | False Positive |
| Predict Negative | False Negative | True Negative |
- Positive and negative don’t mean anything other than the two outcomes
- You could reverse them, nothing would change
Accuracy Calculations
| Outcomes | ||
|---|---|---|
| Predictions | TP | FP |
| FN | TN |
Accuracy Calculations
| Outcomes | ||
|---|---|---|
| Predictions | TP | FP |
| FN | TN |
Confusion Matrix
| Actual Outcome | |||
|---|---|---|---|
| Defaulted | Paid | ||
| Prediction | Predict default | TP | FP |
| Predict pay | FN | TN | |
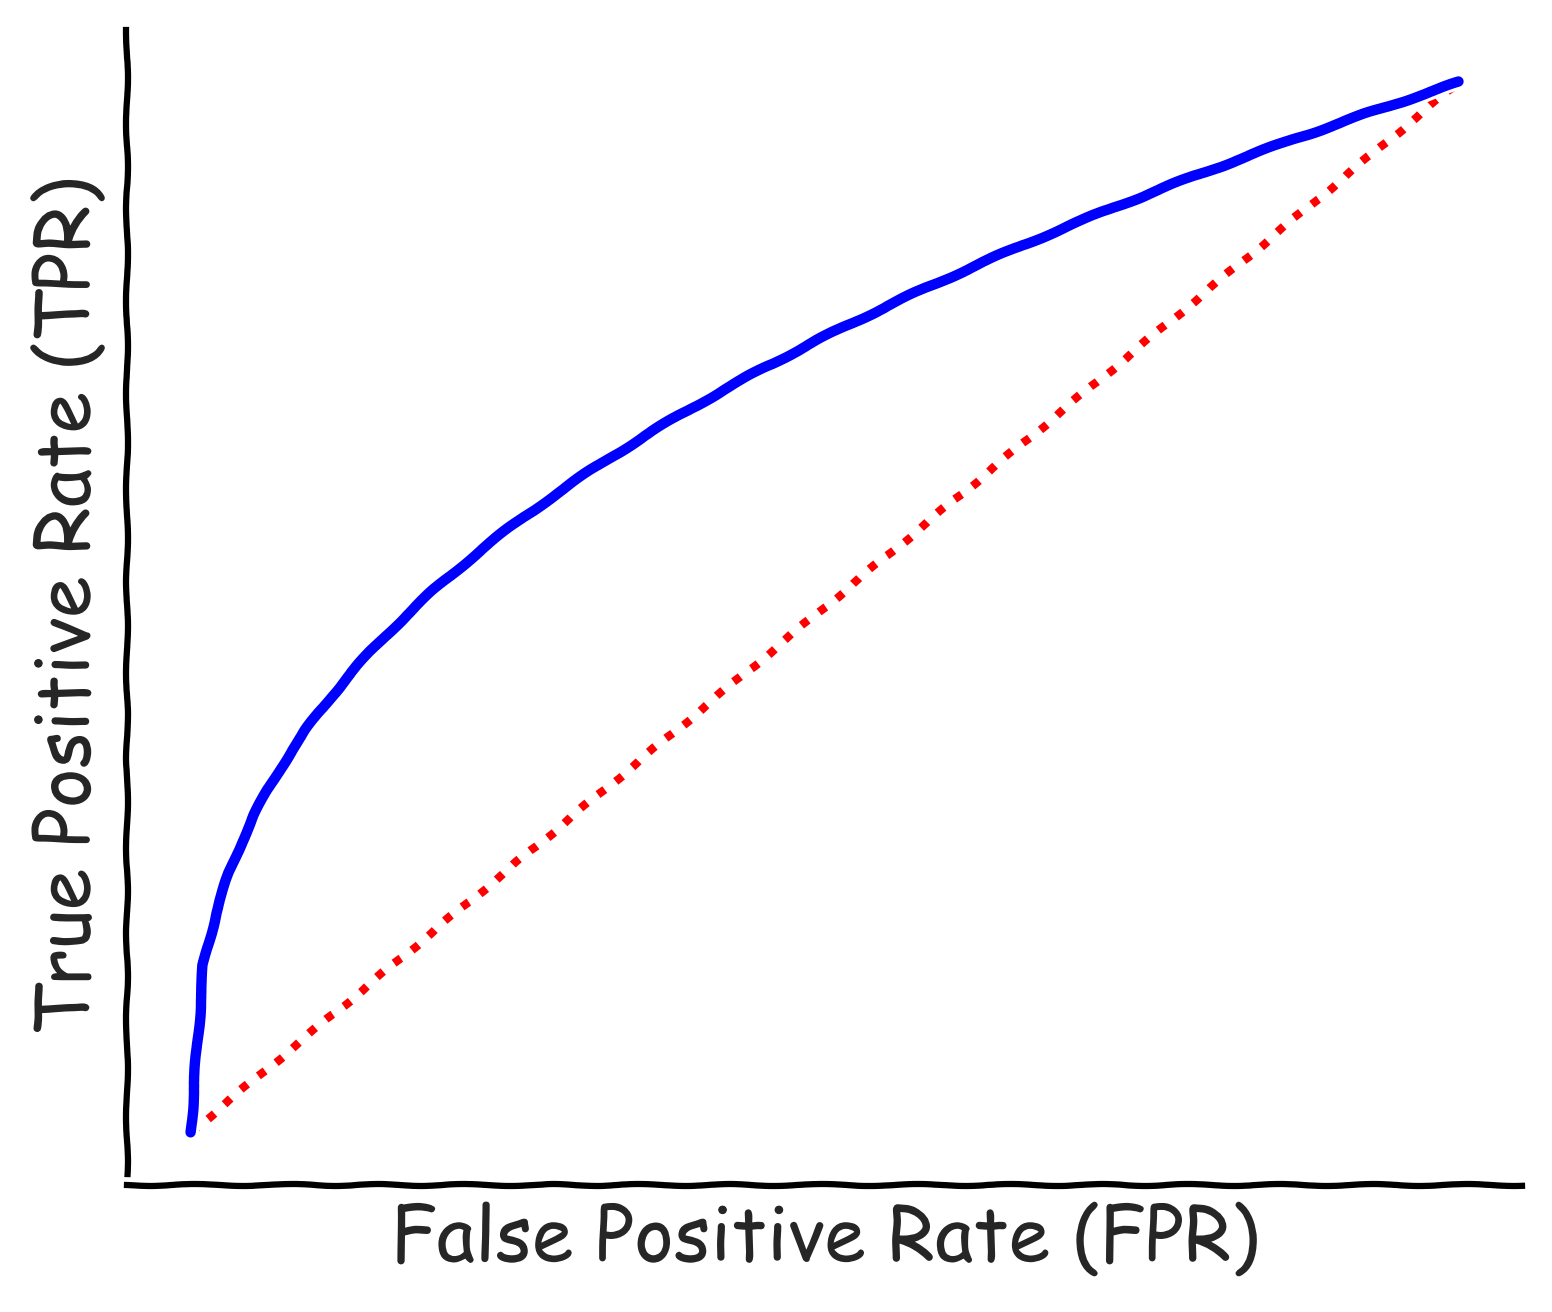
Receiver Operating Curve
Unsupervised Learning
- A bag of skittles is dumped on the floor, and all measurements taken (color, size, location, etc.)
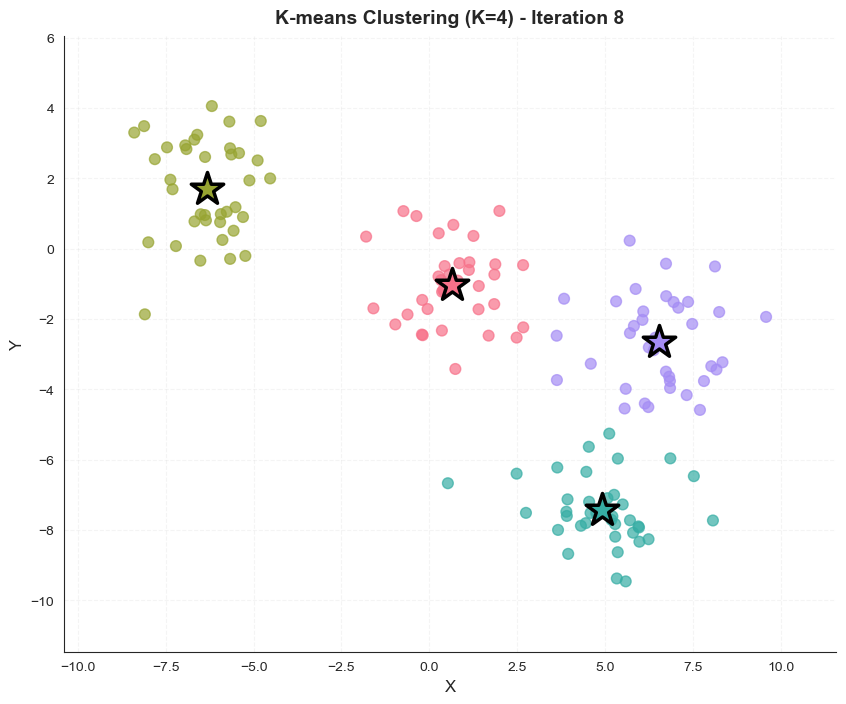
- Clustering – separate skittles into colors
- Dimensionality Reduction – first “factor” is color, then location, no difference in size
Centroid Clustering
Density Clustering
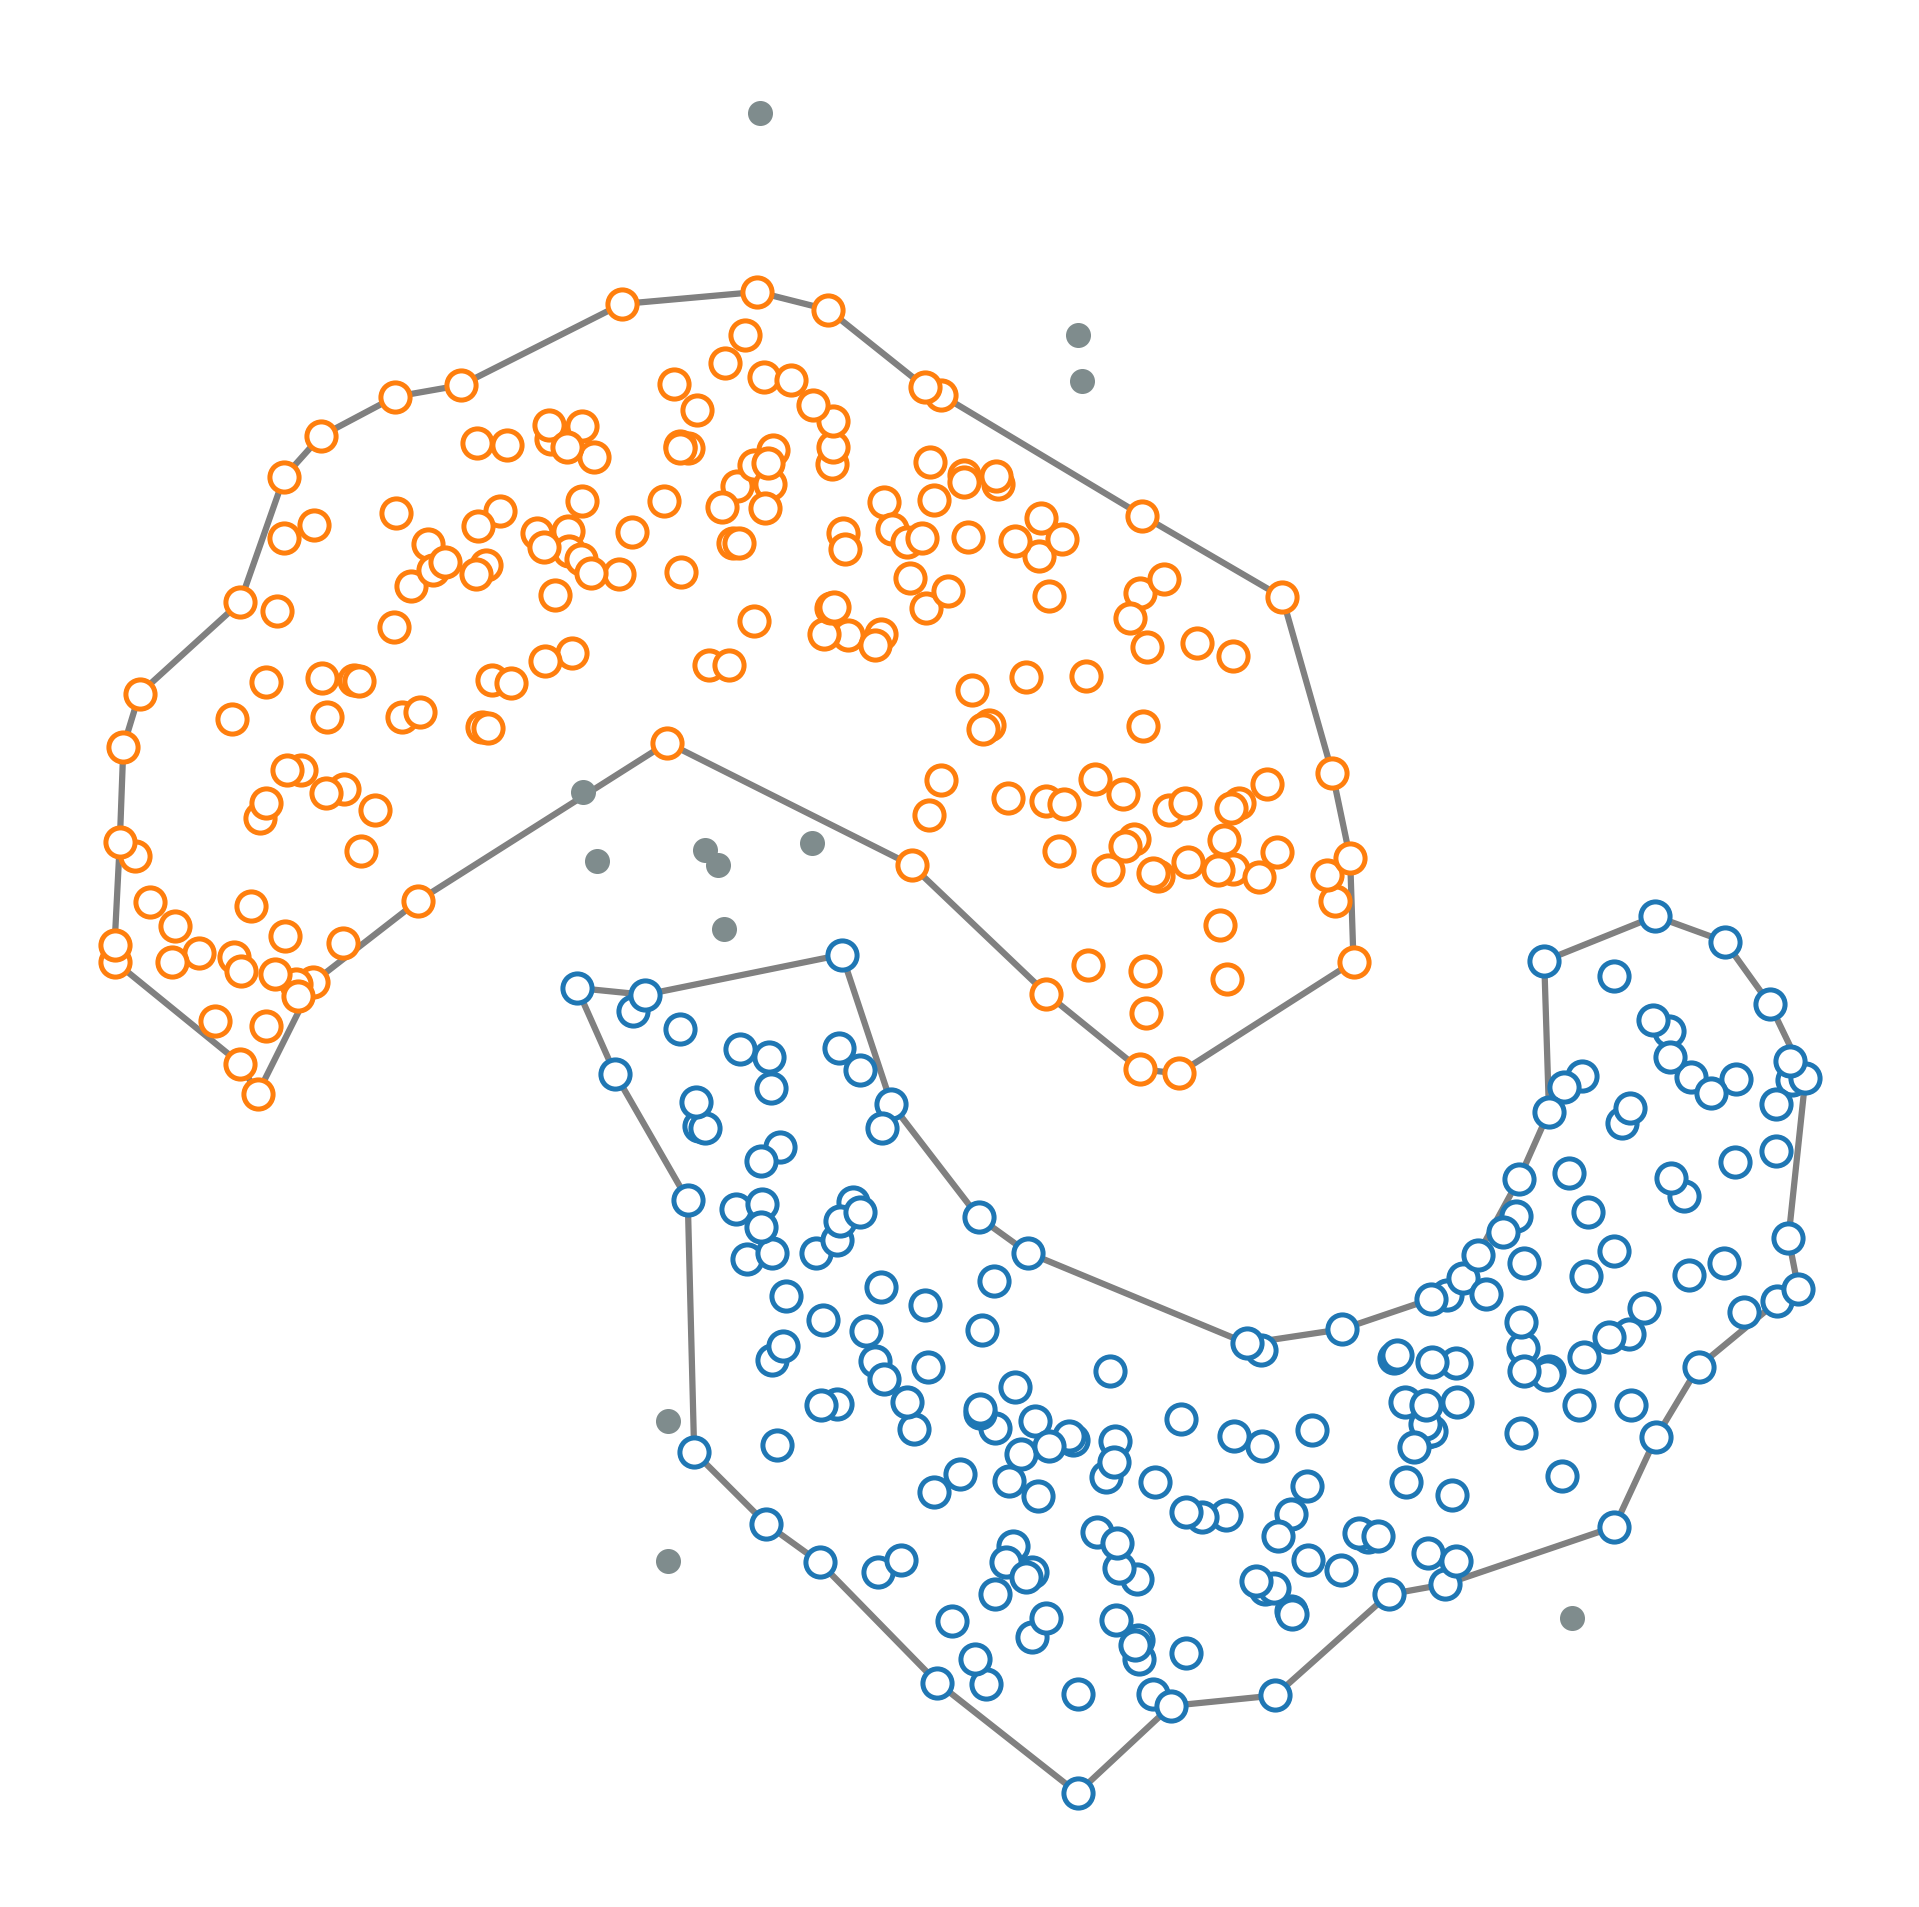
Hierarchical Clustering
Dimensionality Reduction
AI is a big regression
- Still just fitting a line
- A very very very complex line
- LLMs predict next-word probability (e.g., logistic regression)
- Fits the line with a neural network
- Different types of NNs based on connection of neurons
- Transformers changed the game
Transformers: Chat GPT
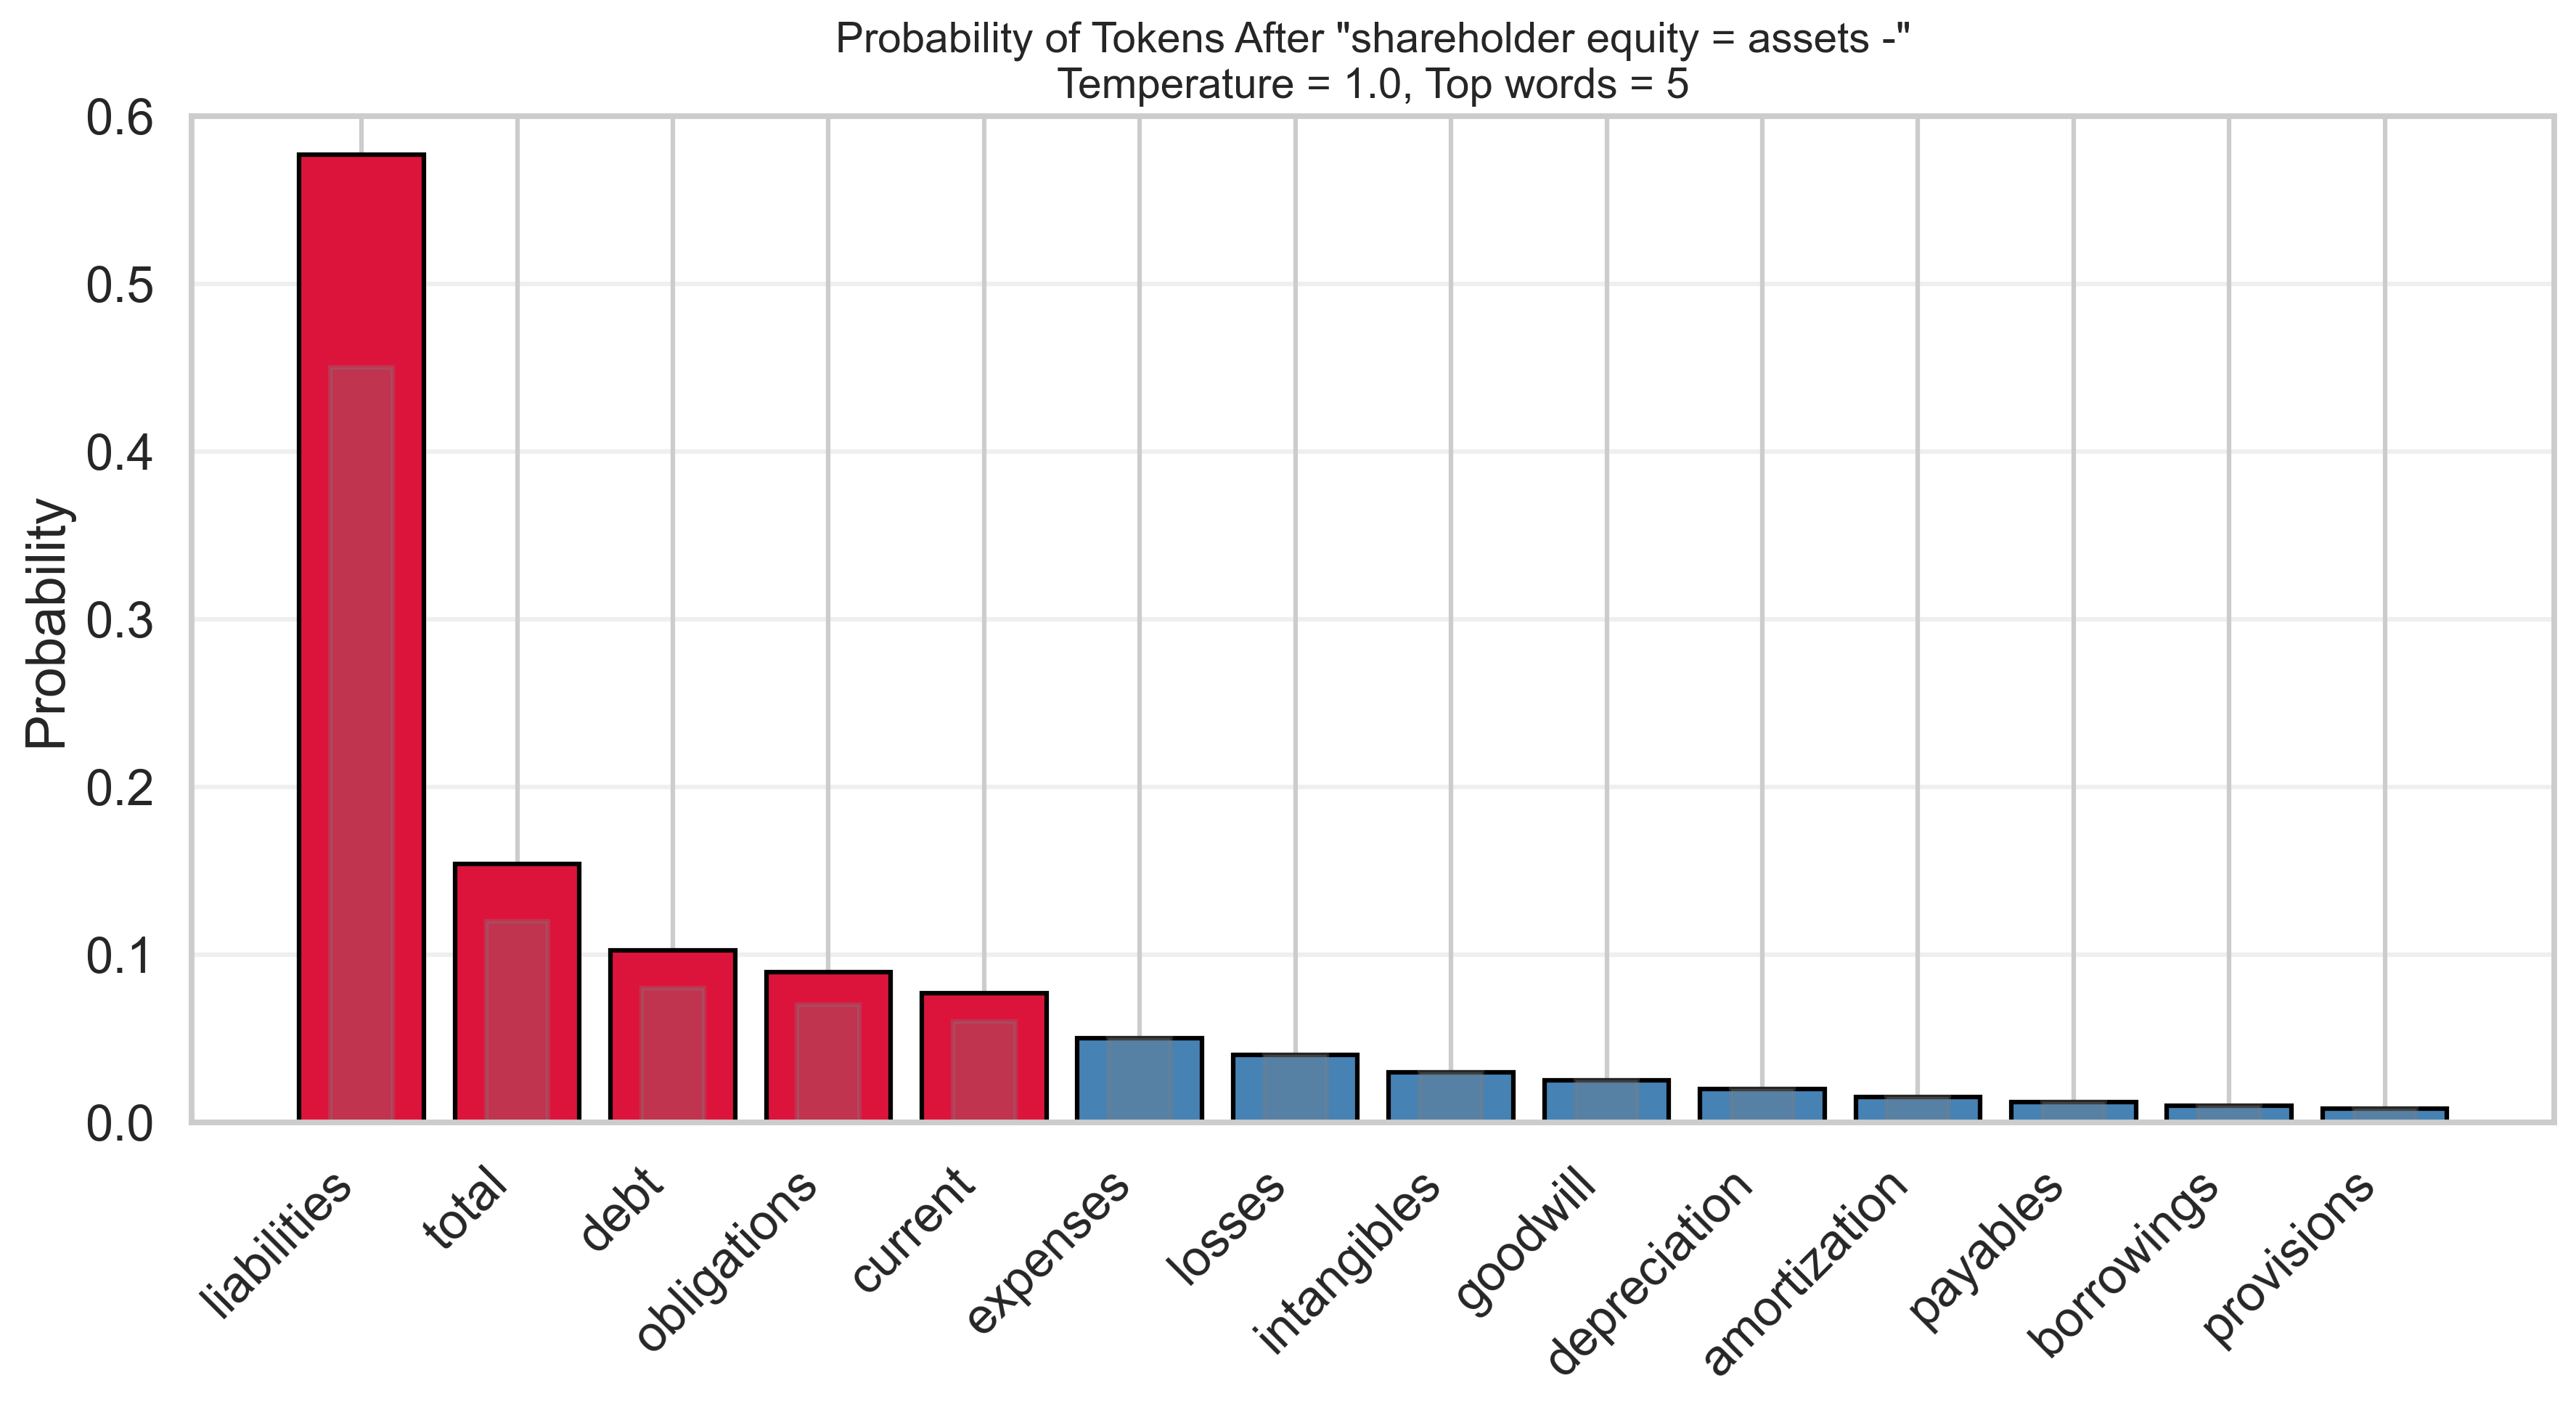
- Text is broken into “tokens”
- E.g., shareholder equity = assets - liabilities
- Network predicts probabilities of next word
- Next word is randomly selected
How LLMs process information
- next word = m * X
- m is the weights (learned coefficients)
- X is the context (input data)
- Human analogy: long vs short term memory
- Weights are everything you know and how you think
- Context is what you’re thinking now (applying that knowledge)
Context Considerations
- The entire context window is included in processing
- A prompt may need refining with some back & forth
- Consider ending with “write a new prompt that captures all the updates over our conversation”, try in new chat
- Use files or other resource to provide necessary info
- E.g. The HTML file from Lab 6 with table details
- Attempt different prompts, require & check citations
- Assistants have pre-set context, data, or examples
Updating LLM Knowledge
- Preloaded context (GPTs / Gems)
- Customized system prompt for specific functionality
- Retrieval Augmented Generation (RAG)
- LLM does a google search (of just your documents)
Enabling Tools for AI
- MCP describes tools in English, simple syntax to call
- MCP client takes LLM output, talks to MCP server
Agentic AI
- Tool using AI: an employee told to do a specific task
- Agentic AI: a manager that decides what tasks to do
- Example: tax agent to analyze tax positions, evaluate adherence to existing regulations and estimate risk
- Incorporates feedback/looping, executing until it observes and decides its objective is met
- Can be hierarchical, high-level agents orchestrating a series of specialized sub-agents
Survey Evidence
- 44% of CFOs report using AI, only 33% at scale
- 88% of employees report using AI
- 37% worry reliance on AI will erode skills & expertise
- 64% of employees report higher workload
- Only 5% using AI to significantly alter their workflow
- Q1 2026: 54% of firms deploying AI agents
- 60% expect humans to manage agent “teams”
value realization gap
- Desire to implement AI / data analytics is ubiquitous
- Ability to do so is not, creating the value gap
- Common frictions to adoption:
- Technology learning curve
- Employee adoption
- C-level acceptance
- Implementation difficulty (trust & governance)
- Data availability
Barriers to Adoption
- Data security & privacy
- 36% employees admit to using non-approved LLM
- Accuracy & data
- Mitigating hallucinations
- Acquiring useful, clean, and reliable data
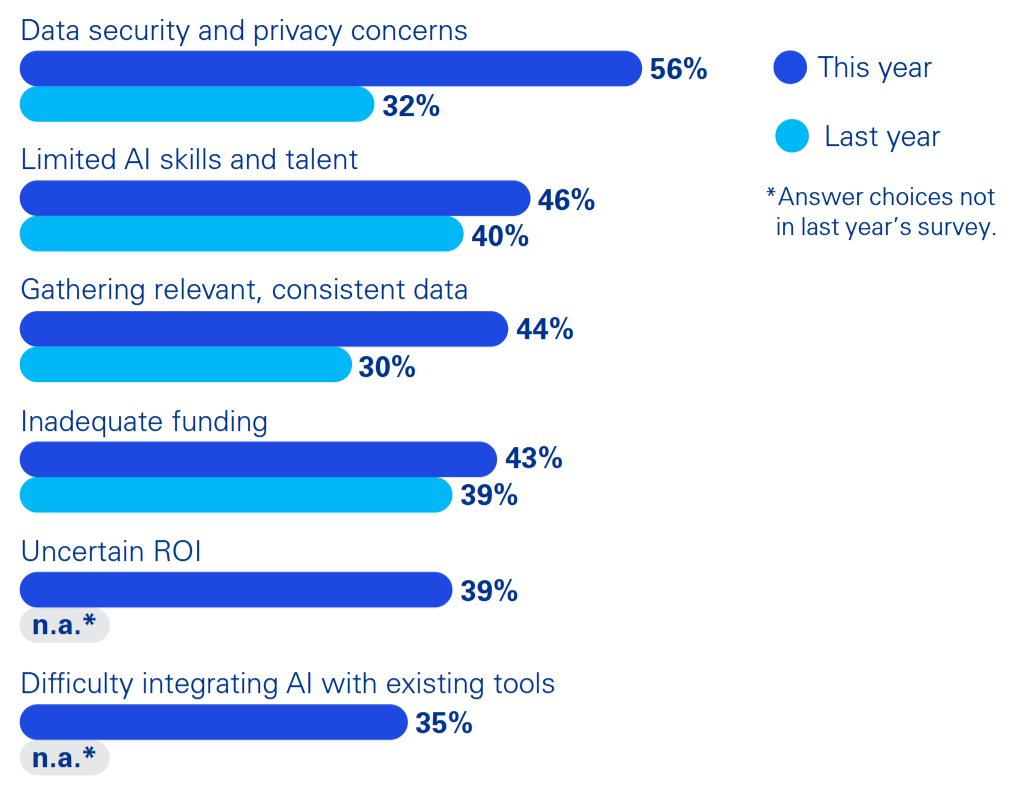
- Source: KPMG AI in financial reporting and audit, 2024
Smart Alliance
- ACCA report finds half of accounting and finance leadership in AI adoption roles, 20% strategic owners
- Natural extension for the business data roles
- Moving from data preparation to advisory roles
What you did
- Data engineering: clean data, ETL, SQL, EDA
- Data visualization: histograms, line charts, trends
- Data analysis: regressions, classifiers
- AI: vibe coding
Illusion of Knowledge
- “The greatest enemy of knowledge is not ignorance, it is the illusion of knowledge.” ~ Daniel J. Boorstin
- “If you can't explain something to a six-year-old, you really don't understand it yourself.” ~ not Albert Einstein
- As the data expert, you are the most valuable and necessary part of the analysis. ~ Me
Healthy Skepticism
- Analytical models can be very powerful
- But that doesn’t obviate your professional skepticism
- Apply your domain knowledge
- Question the assumptions
- Question the model
- Question the data
Coming up
- Wednesday: Lab 12 & Project 4 work-session
- Next week (week 14):
- Monday: Live lab / demo
- Wednesday: KPMG AI guest speakers
- Week 15: Presentations
- Sign up on spreadsheet in announcement
- Load presentation slides before class
- Hard stop at 10 minutes