Week 1
Welcome to Accounting Analytics
- Instructors
- Maclean Gaulin
Business Analytics Map
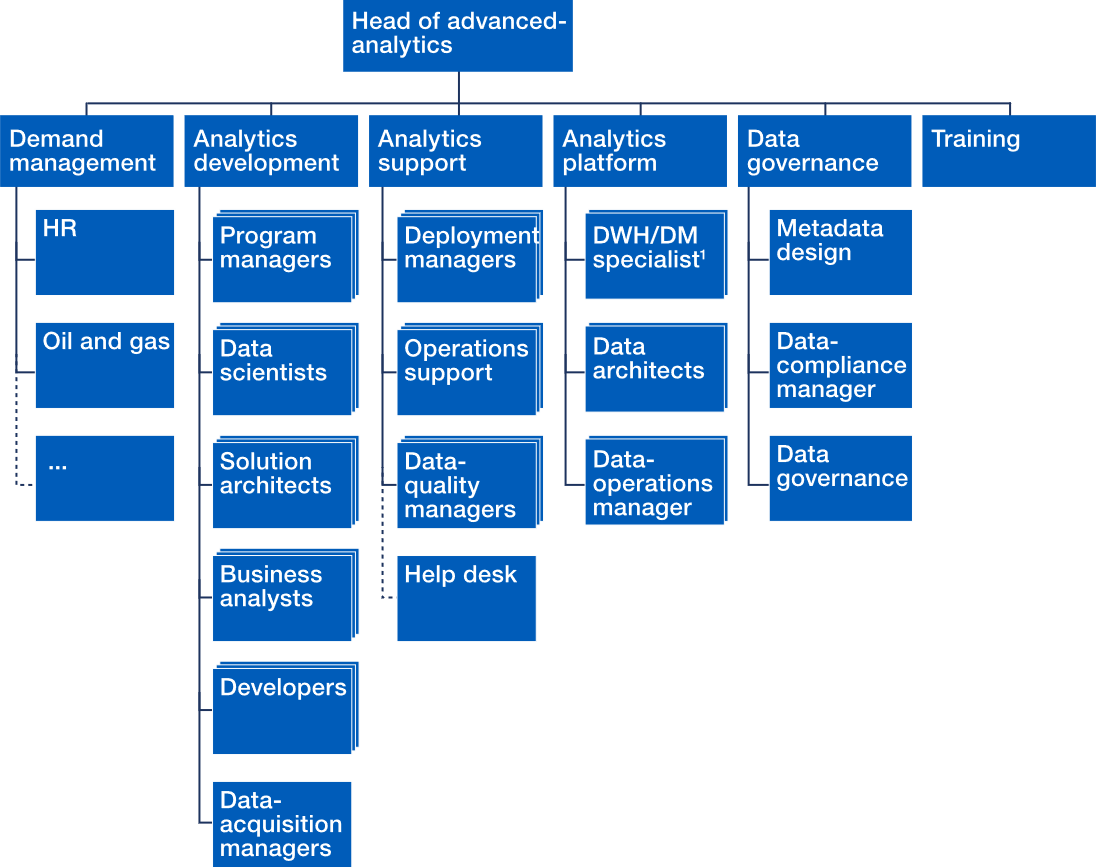
- Source: mckinsey.com/industries/financial-services/our-insights/building-an-effective-analytics-organization
Class Pedagogy
- High level overview
- Hands-on practice
- Invest where your interest lies
Class Goals
- Learn how to communicate and consume data analytics in a business setting
- Learn some jargon
- Learn to identify (and avoid) fluff / deception
- Learn the tools to perform data analytics
- Hands-on practice of the topics & tools
- Learn how your Accounting domain knowledge is your key to success
Key concept
Your accounting expertise is your competitive advantage in analytics
Healthy Skepticism
- Analytics can be very powerful
- But that doesn’t obviate your professional skepticism
- Apply your domain knowledge
- Question the assumptions
- Question the model
- Question the data
Key concept
Analytics augments professional judgment — it doesn't replace it
Class Structure
- Motivate
- Lectures
- Learn
- Apply
- Projects
- Lab
- Practice
- Homework
Lectures
- Cover the content for the course
- High level, dense descriptions
- You should deep-dive on those topics that tickle your fancy, as you will do in your career
- All visualizations made with python, all code available on github
Deliverables
- Assignments all focus on destination, not the journey
- I have structured the course around 2 “modalities”
- Spreadsheets (e.g., Excel)
- Programming (e.g., Python)
- Optional: BI software (e.g., Tableau)
- Consider what your strengths are, what you want to learn, and what LLMs can help you with
Labs and Homework
- Labs will focus on application of the week’s topics
- Guided, application focused
- Homeworks will be practice of the week’s topics
- Self guided, deliverable focused
- You can work in any language/platform
- Excel – easier for some topics, harder for others
- Python/R – DIY, bigger learning curve, what I use
- Tableau/Power BI – more fully featured, learning curve
Key concept
Use any tool you like — Excel, Tableau/Power BI, or Python/R
Projects
- 4 projects throughout the course
- 3 pre-determined, 1 choose your own adventure
- Deliverable will be short slide-deck
- Focus on communicating conclusion
- Your audience will be clearly defined
- Intended to simulate what a DA would do
- Project 4 will have presentations in weeks 14&15
Key concept
Deliverables are short, audience-aware slide decks — just like a real analyst's
Grading
- Based on Labs, Homeworks, Projects
- Not based on: exams, quizzes, presentation
Key concept
Projects and homework carry the most weight — applied work matters most
About me…
Uses of Data Analytics in Business
- Data-driven decision-making
- Improved operations
- Improving efficiency of existing business lines
- Reducing product and administrative costs
- Supply chain optimization
- Better customer understanding
- Demand estimation
- Customized product offerings and support provision
- Risk assessment/management
- Regulatory compliance
Gamut of analytics in accounting
- Acquisition: collecting and measuring data
- Cleaning: ensuring the quality of the data, audits
- Storage: could just be excel, but hopefully not!
- Combination: combining multiple data sources
- Analysis: modeling the economics
- Data driven decisions: using analytical conclusions to inform decision-makers
- Communication: conveying accounting insights
Where you fit in
- Regardless of your analytics chops, your domain expertise will always be valuable
- Don’t underestimate how impactful knowing accounting can be in DA conversations
- Don’t overestimate how much others know about accounting, you’re the expert!
- Play to your strengths
Illusion of Knowledge
- “The greatest enemy of knowledge is not ignorance, it is the illusion of knowledge.” ~ Daniel J. Boorstin
- “The greatest enemy of knowledge is not ignorance, it is the illusion of knowledge people using big words.” ~ Daniel J. Boorstin Mac
- “If you can't explain something to a six-year-old, you really don't understand it yourself.” ~ not Albert Einstein
value realization gap
- Desire to implement data analytics is ubiquitous
- Ability to do so is not, creating the value gap
- Common frictions to adoption:
- Technology learning curve
- Employee adoption
- C-level acceptance
- Implementation difficulty
- Data availability
Audit Analytics
- Move to full-population testing (Audit by exception)
- Risk assessment
- Trend analysis, clustering
- Substantive testing for material misstatement risk
- Internal and continual audit
Tax Analytics
- What-if analyses for tax planning (e.g. tax credits, bonus depreciation, etc.)
- Separate the sources of tax burden (segment, geographic, category, etc.)
- Industry comparison of effective tax rates
- Analyze and explain GAAP vs tax income differences
- Estimate risk of tax positions & compliance
- Transfer pricing schedule optimization
Financial Analytics
- Preparation of financials
- Data combination, cleaning, aggregation, error detection and correction
- Financial Statement Analysis (FSA)
- Market returns and volume analyses
- Investor communication analysis
Managerial Analytics
- Decision-making with accounting/business data
- Budgeting and forecasting
- Reporting and Key Performance Indicators (KPIs)
- Cost Accounting and production function estimation
- Performance measures and evaluation
- Efficient, performance-based compensation
AI in Accounting
- Automation, Robotic Process Automation (RPA)
- Data ingest, cleaning, merging, quality control
- Continual process monitoring (i.e., internal controls)
- Analysis of all transactions instead of sampling
- Move from hoping to catch errors to looking for them
- Risk assessment and management
- Detection of anomalies, misstatements, fraud, etc.
- Forecasting and predictive modeling
KPMG 2024/Q4 survey on AI Adoption
- 50% currently scaling their GenAI & adopting agents
- Only 12% have deployed agents
- 31% expect positive ROI in the next six months
- 0 believe they have positive ROI now
- Top challenges to adoption:
- data: 85%, data privacy: 71%, employee adoption: 46%
PCAOB 2024/Q2: on Current Use of GenAI
- Creating initial drafts of internal documents
- Preparing administrative documents and initial drafts of memos and presentations related to an audit
- Preparing account reconciliations and assisting with identifying reconciling items
- Research internal accounting and auditing guidance
PCAOB 2024/Q2: on Future Uses of GenAI
- Assisting with summarizing accounting policy and legal documents
- Evaluating the completeness of audit documentation against relevant documentation requirements
- Performing certain risk assessment procedures
- Scoping the audit
- Evaluating the completeness of financial statement disclosures
- Comparing amounts in the financial statements or notes with audited amounts
AI Caveats and Concerns
- Output quality
- Mistakes / errors leading to real-world consequences
- Not achieving expected value
- Good at some things, bad at others
- Models learn the data they were trained on
- LLMs seem to model simple logic
- “Thinking” models break task down into simple steps
- LLMs don’t form a coherent world model
Course Overview
- Week 1: This, right now, it’s almost over
- Week 2: Data in Companies
- Week 3: Visualization
- Week 4: Exploratory Data Analyses
- Week 5: Combining Data
- Week 6: Automation and ETL
- Week 7: Unstructured data
- Week 8: Analytics Overview
- Week 9: Regressions
- Week 10: Classification
- Week 11: Unsupervised Learning
- Week 12: Foundational Models
- Week 13: Flex Week
- Weeks 14-15: Presentations
- Data
- Analytics
- AI
Key concept
Five moving parts: videos, webinar, lab, homework, projects